During various discussions about the puriFlash® MS, the maximum mass limit of this detector (2000 m/z for the puriFlash®MS L). is often mentioned. This parameter is important, especially for high molar mass compounds, as is regularly the case for larges peptides.
To accelerate the identification of these products, our system allows with an algorithm, to go back to the molar mass of this one, it is the charge deconvolution.
With an application, we will show how easy it is to get this information.
Deconvolution of the state of charge: a simple method to intensify the signal
In mass spectrometry, peptides are visible with an ESI source. Under “soft” conditions, they can ionize several times, which makes them visible in the m/z range of the puriFlash® MS.
Knowing the charge of the different peaks in the mass spectrum, an algorithm allows to automatically “find” the initial mass of the peptide.
The Advion deconvolution algorithm employs a combination of predictive charge envelope generation, overlap calculation with actual MS data acquired utilizing a maximum entropy goodness of fit approach followed by artifact removal through determination of peak significance. This novel approach allows for a rapid deconvolution over a wide mass range in seconds. It also allows a neutral mass output where the absolute signal intensity is directly correlated to the MS raw data signal intensity and analyte concentration in solution.
In practice, with puriFlash® MS, it is very simple to perform this operation.
All you have to do is:
- Acquire the mass spectrum of the compound with the software “Advion Data express”:

- For better vizualisation, remove the background of the signal
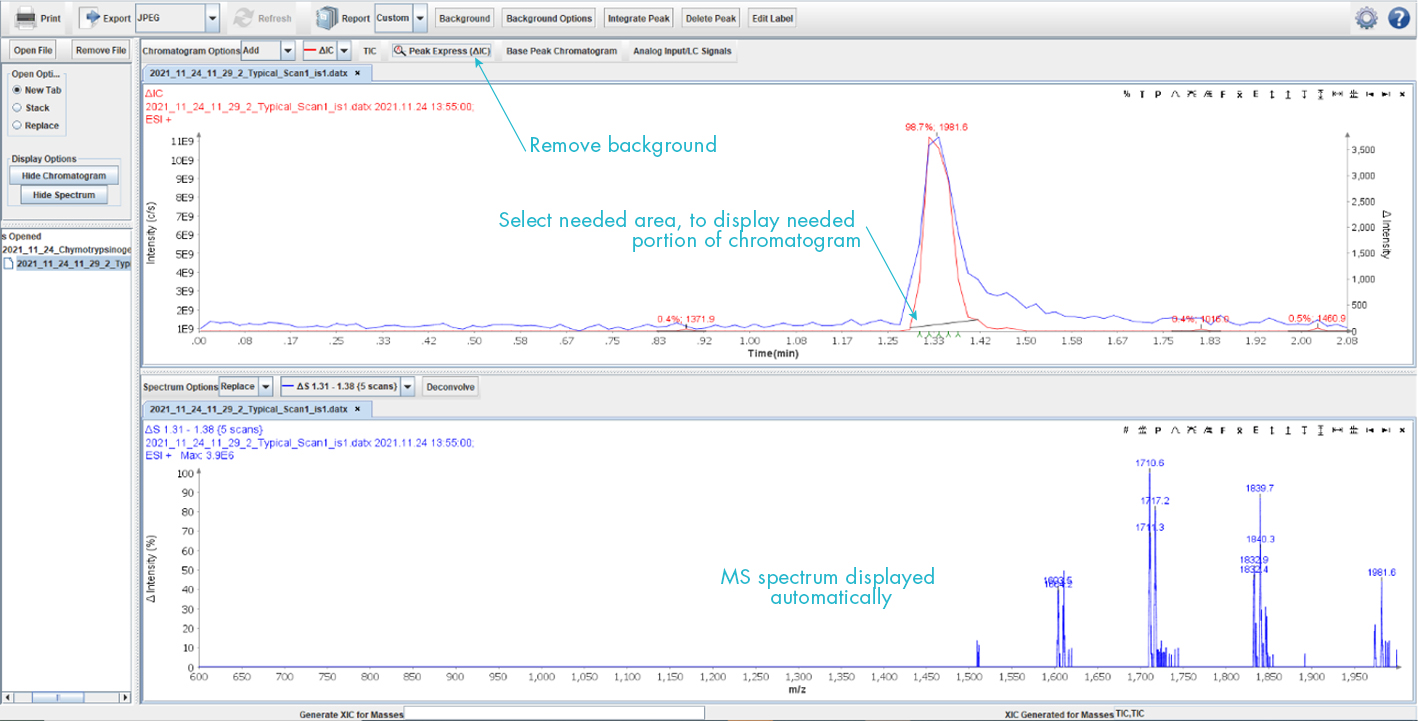
- Deconvolve
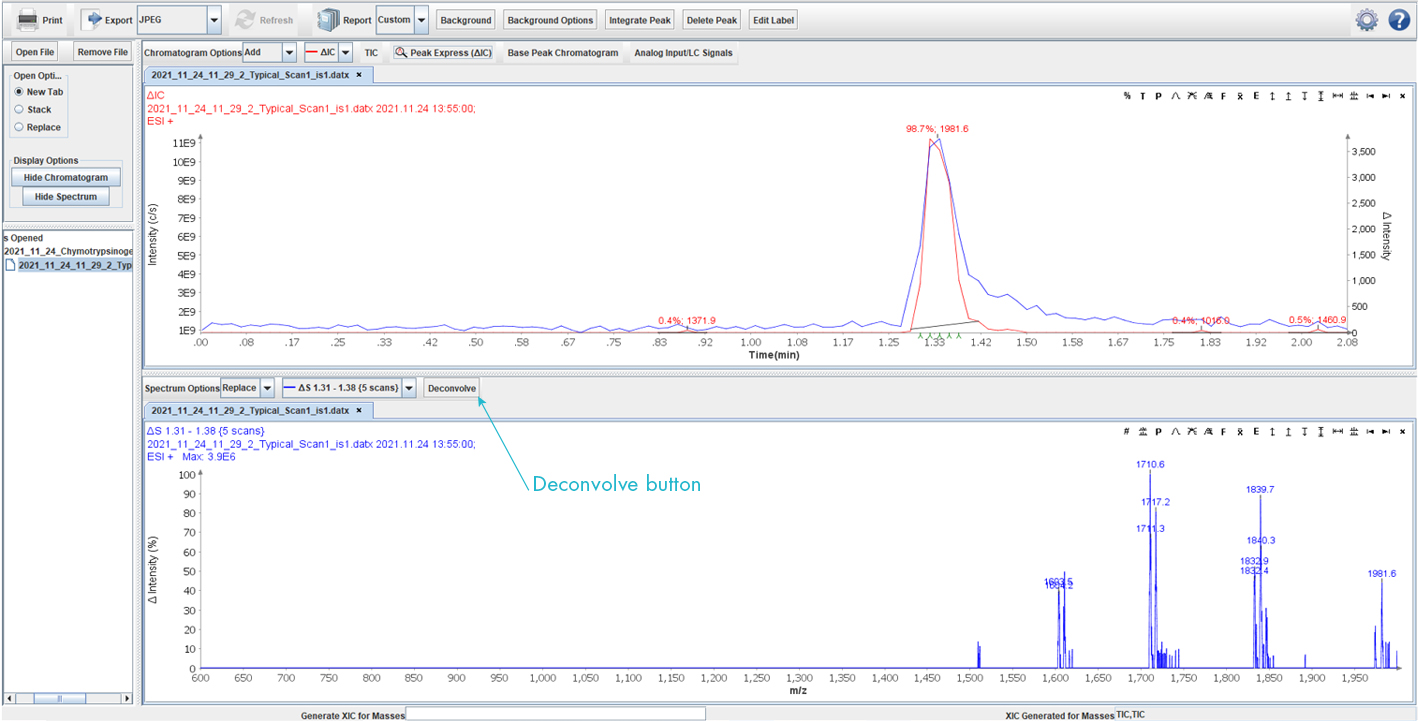
When you click on the button “deconvolve”, a window appears, you can indicate:
 |
|
Then click on “OK”, deconvolve spectrum is displayed.
Application
First, we developed a reverse phase purification of 4 peptides with molar masses between 10 and 27 kDa.
As we do not know the output order of the different peptides, they will be collected to be identified by direct injection on the puriFlash®MS.
Finally, the method will be optimized in order to decrease the time of the run.
System: puriFlash® 5.250P
Solvents:
A: Water + 0,1 % AF
B: Acetonitrile + 0,1 % AF
Column: PM-30C18-F0025
Flow rate: 15 mL/min
Injection mode: liquide (composés lyophilisés reconstitués et mis en solution)
Injected volume: 150 µL
Compounds:
Cytochrome c from horse heart (P/N: 1J484A)
Lysozyme from chicken egg white, salt free (P/N: 6D6694)
Myoglobin Type I. horse skeletal muscle (P/N : 294440)
Chymotrypsinogen A, from bovine pancreas (P/N: IYQ650)
Gradient :
| T (min) | A % | B % |
| 00:00 | 75.0 | 25.0 |
| 23:00 | 47.0 | 53.0 |
| 23:03 | 0.00 | 100 |
| 30:00 | 0.00 | 100 |
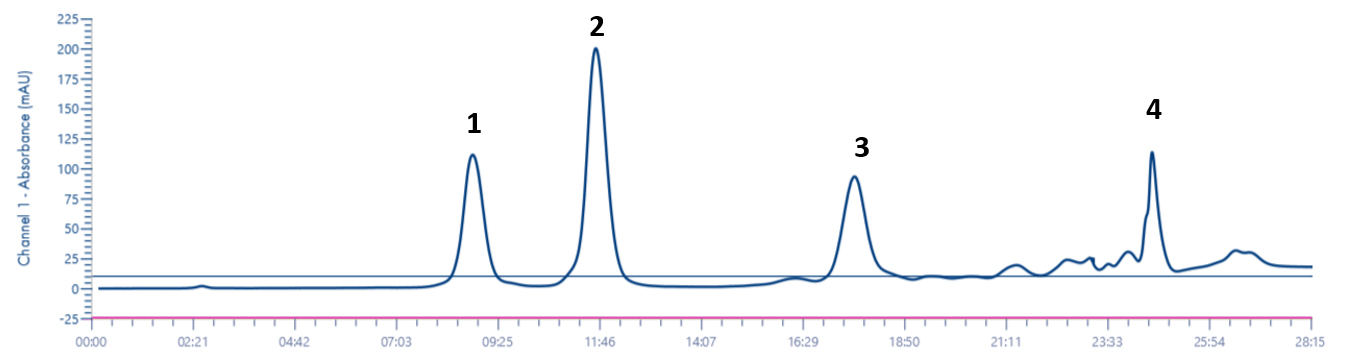
Result :
Conclusion
The different peaks were collected in collection tubes to be identified with puriFlash®MS in direct injection.
MS conditions:
Solvents make-up: Water (20%) / MeOH (80%) + 0,1% AF
Flow rate: 0,2 mL/min
Source type: ESI
Source parameters:
Mode: Positif
Capillary temperature: 200°C
Capillary voltage: 160 V
Source voltage offset: 30 V
Source voltage span: 5 V
Source gas temperature: 250 °C
ESI Voltage: 3500 V
The spectra obtained are as follows:
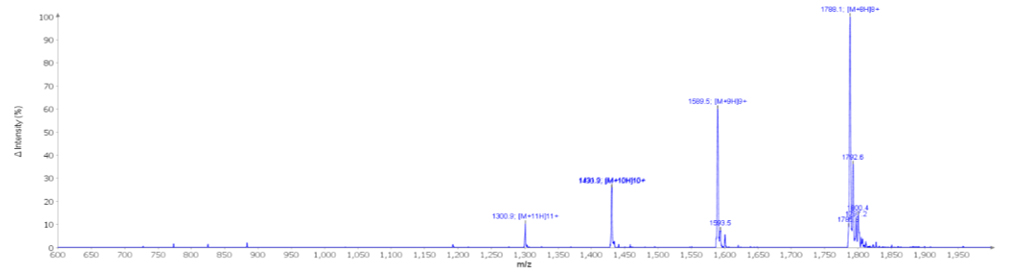
Peak 1: MS spectrum

Result after charge deconvolution
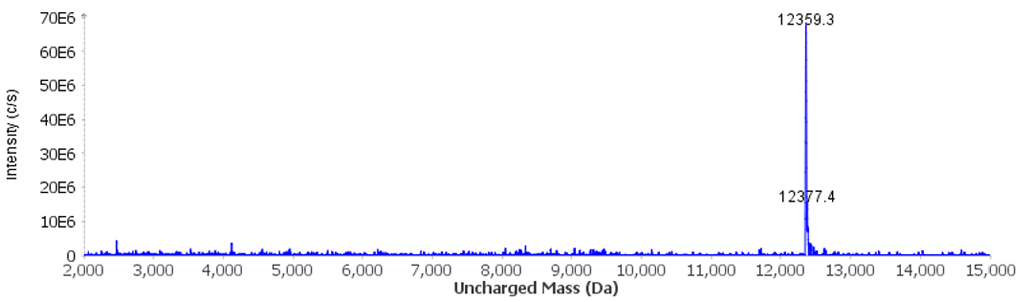
The result after MS analysis of the first fraction, shows that the compound is Cytochrom C of MW ~11.8kDa.
Peak 2: MS spectrum
Result after charge deconvolution
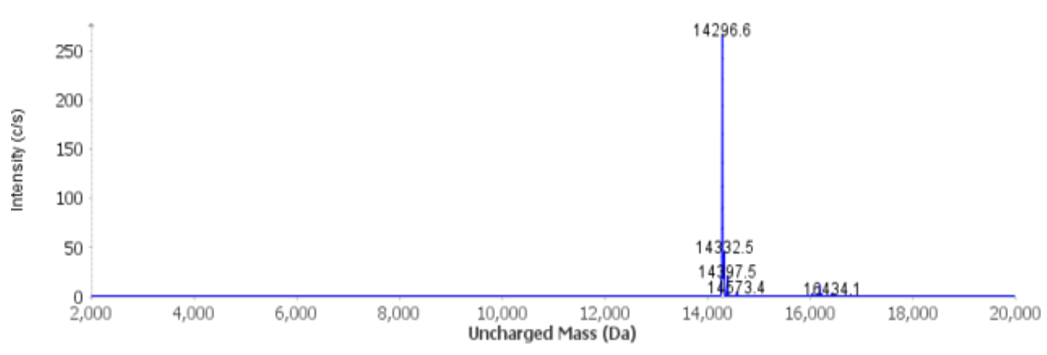
The result after MS analysis of the second fraction, shows that the compound is lysozyme, MW ~14.3kDa.
Peak 3: MS spectrum
Result after charge deconvolution
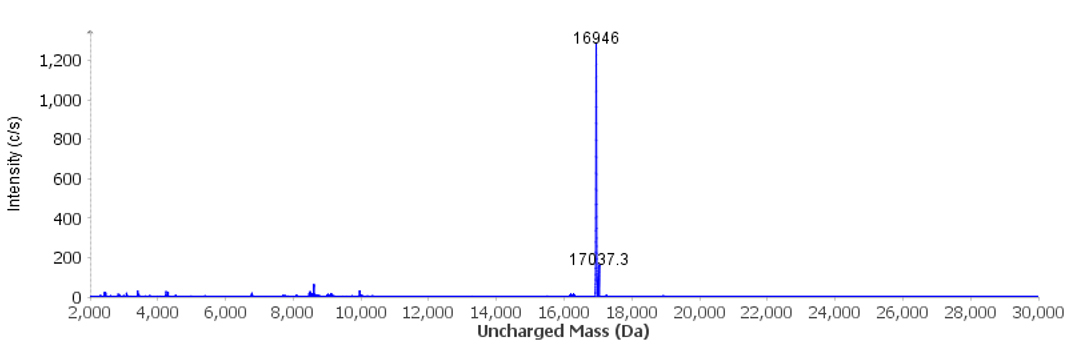
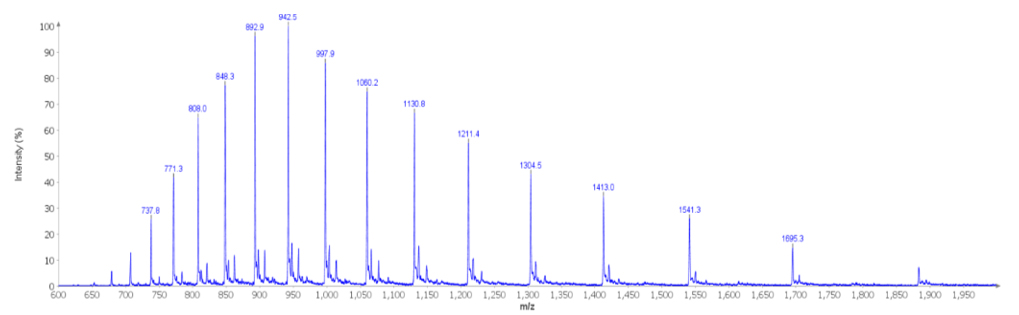
The result after MS analysis of the third fraction, shows that the compound is Myoglobin, MW ~17kDa.
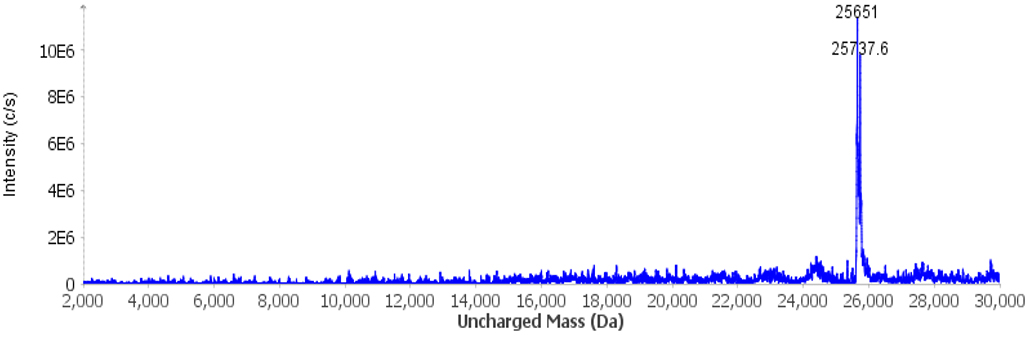
Peak 4: MS spectrum
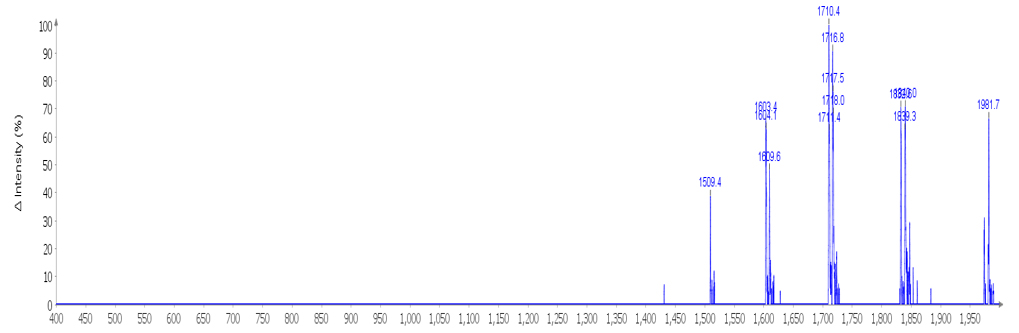
Result after charge deconvolution
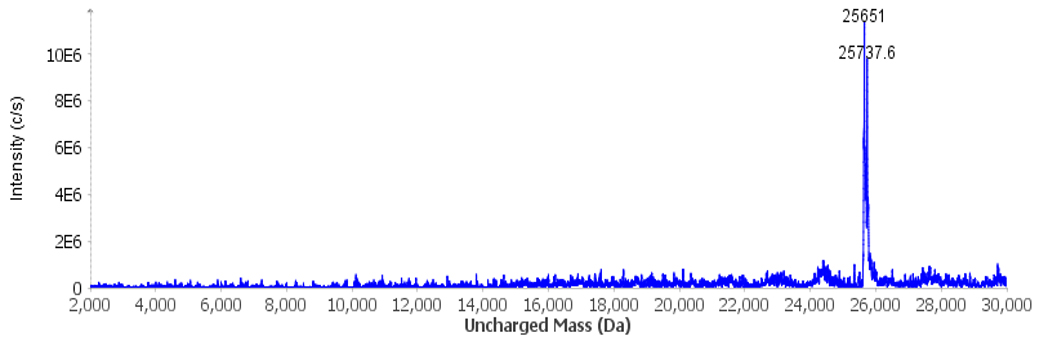
The result after MS analysis of the last fraction, shows that the compound is Chymotrypsinogen of MW~25.6kDa.
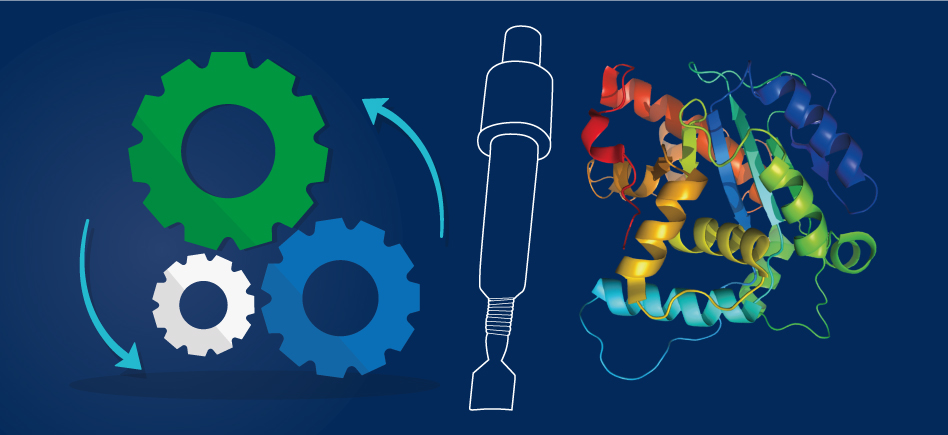
Optimization
Once the different peaks were identified, the method was optimized to allow faster purification, while maintaining the needed level of purity, using puriFlash® Monolith columns.
Gradient :
| T (min) | A % | B % |
| 00:00 | 75.0 | 25.0 |
| 07:00 | 47.0 | 53.0 |
| 07:03 | 0.00 | 100 |
| 11:00 | 0.00 | 100 |
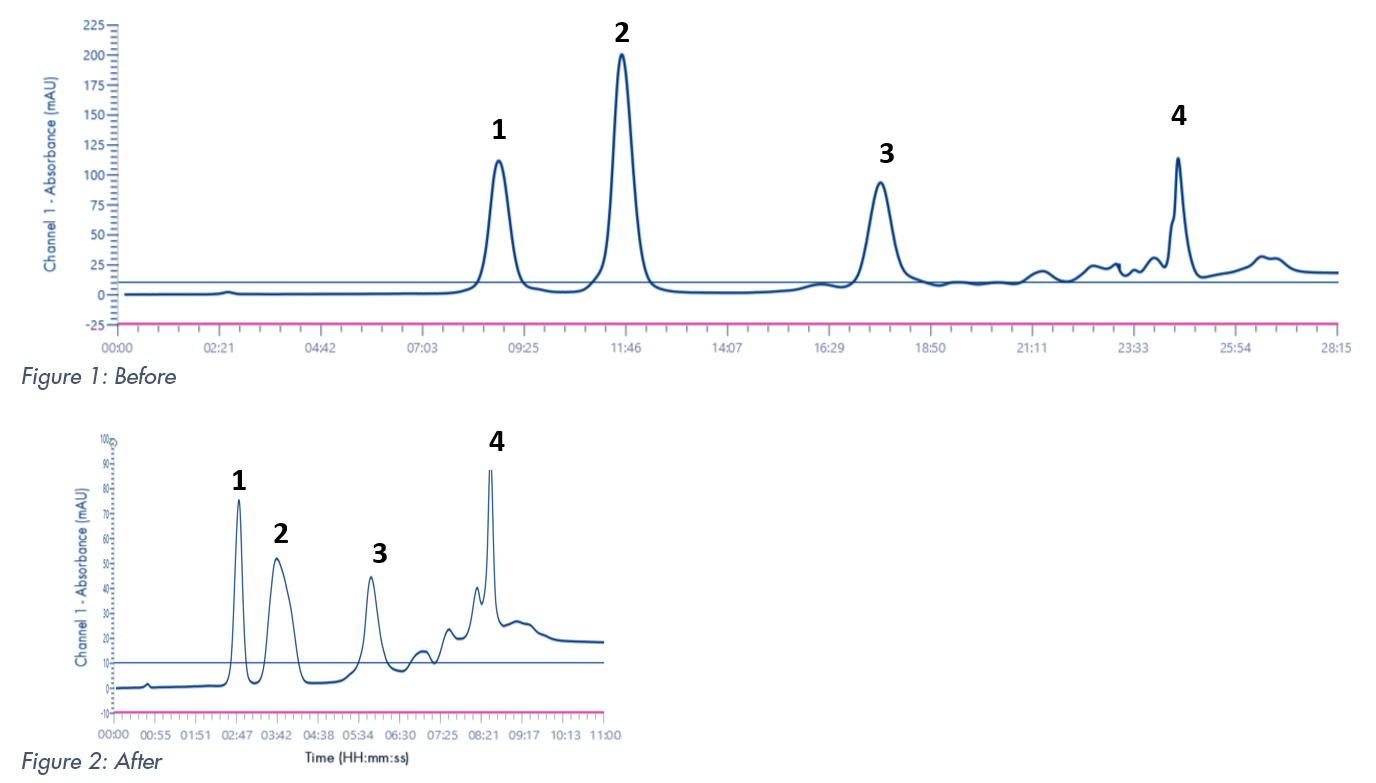
Purification step was decreased by 60%.
Conclusion
The puriFlash® MS allows for rapid identification of compounds and combined with the performance of the puriFlash® Monolith phase, it is possible to reduce your purification time.
In addition to being compatible with the puriFlash® range of instruments, the puriFlash® MS is very versatile:
- Coupled to HPLC or purification systems
- Couple to an express plate to analyze TLC plate spots
- Install a source for solid injection (ASAP)
- Install a source for direct analysis by open port (OPSI)
- Identify large molecules, thanks to the charge deconvolution function, quickly and easily by post run processing.
Know more:
- Visit our website www.flash-chromatographie.com for more details
- Do not hesitate to contact us: info@advion-interchim.com


