
Real-Time PCR Mix Evaluation Guideline
When evaluating a new real-time PCR master mix it is important to look at the correct parameters. This guideline provides a protocol and tips on how to perform a quick evaluation of a real-time PCR master mix.
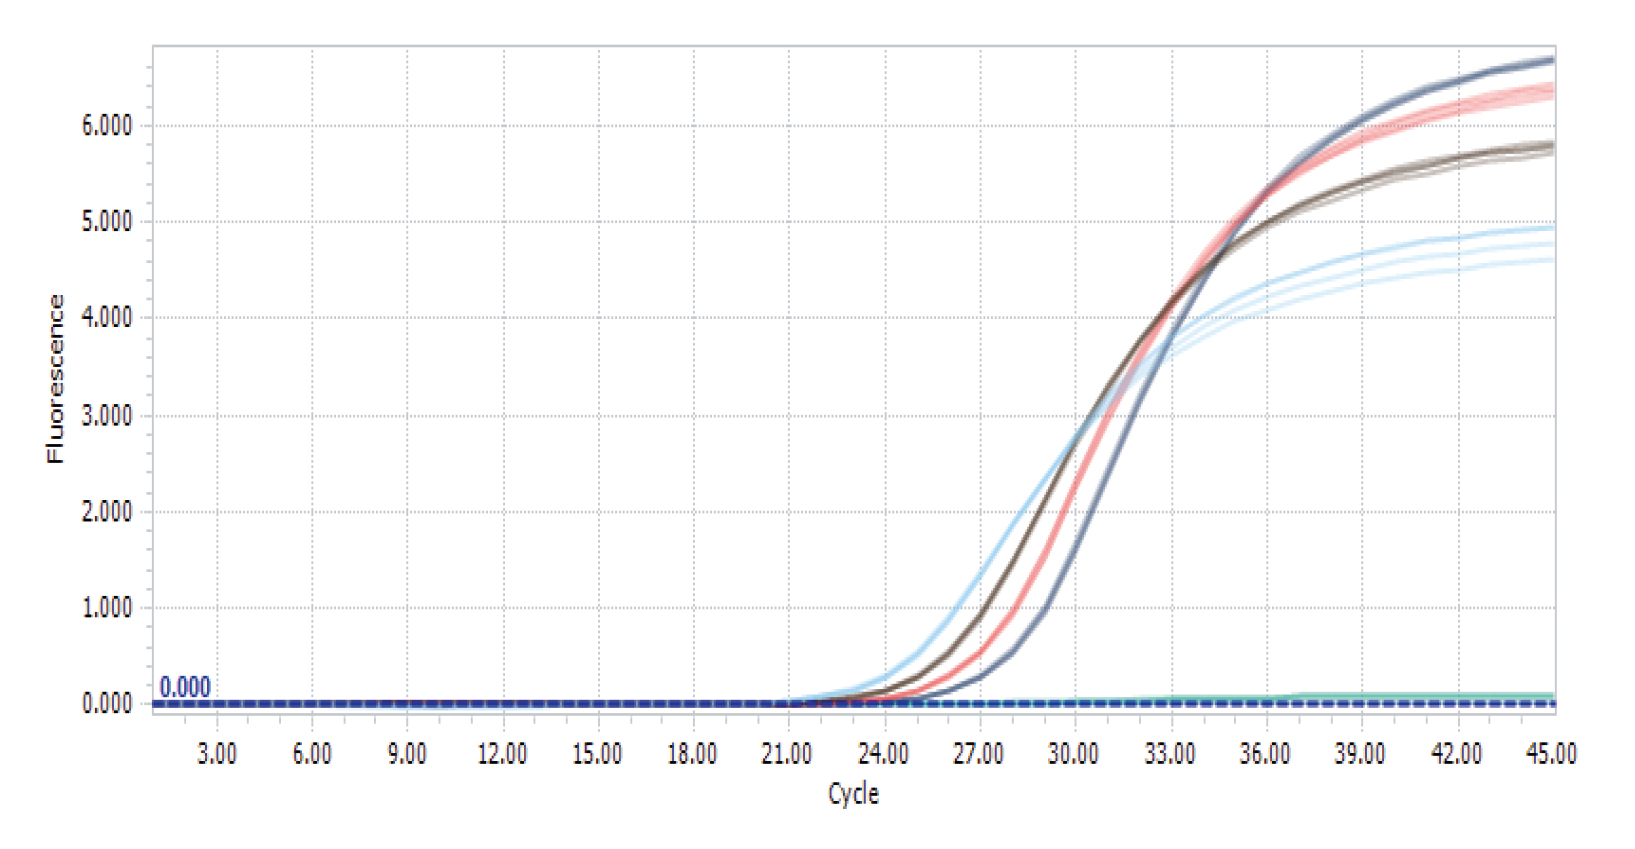
Amplification plot for RealQ Plus Green run on LightCycler® 96
1. Prepare a DNA dilution series
Prepare a DNA dilution series according to the figure below. Mix well by flicking the tubes (do not vortex!) and spin down.
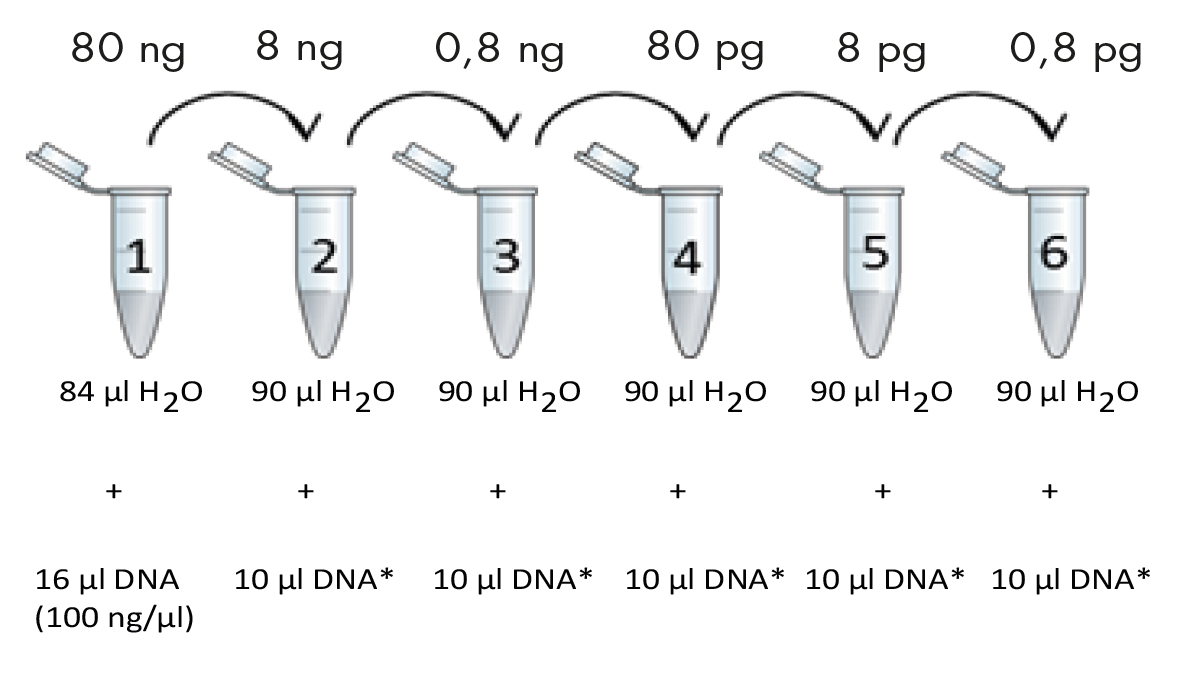
*Employ previous dilution.
For genomic DNA include tubes 1-4. For other types of DNA include tubes 1-6. Initial DNA concentration is 100 ng/µl. Final DNA concentrations in each tube are noted in the boxes above the tubes.
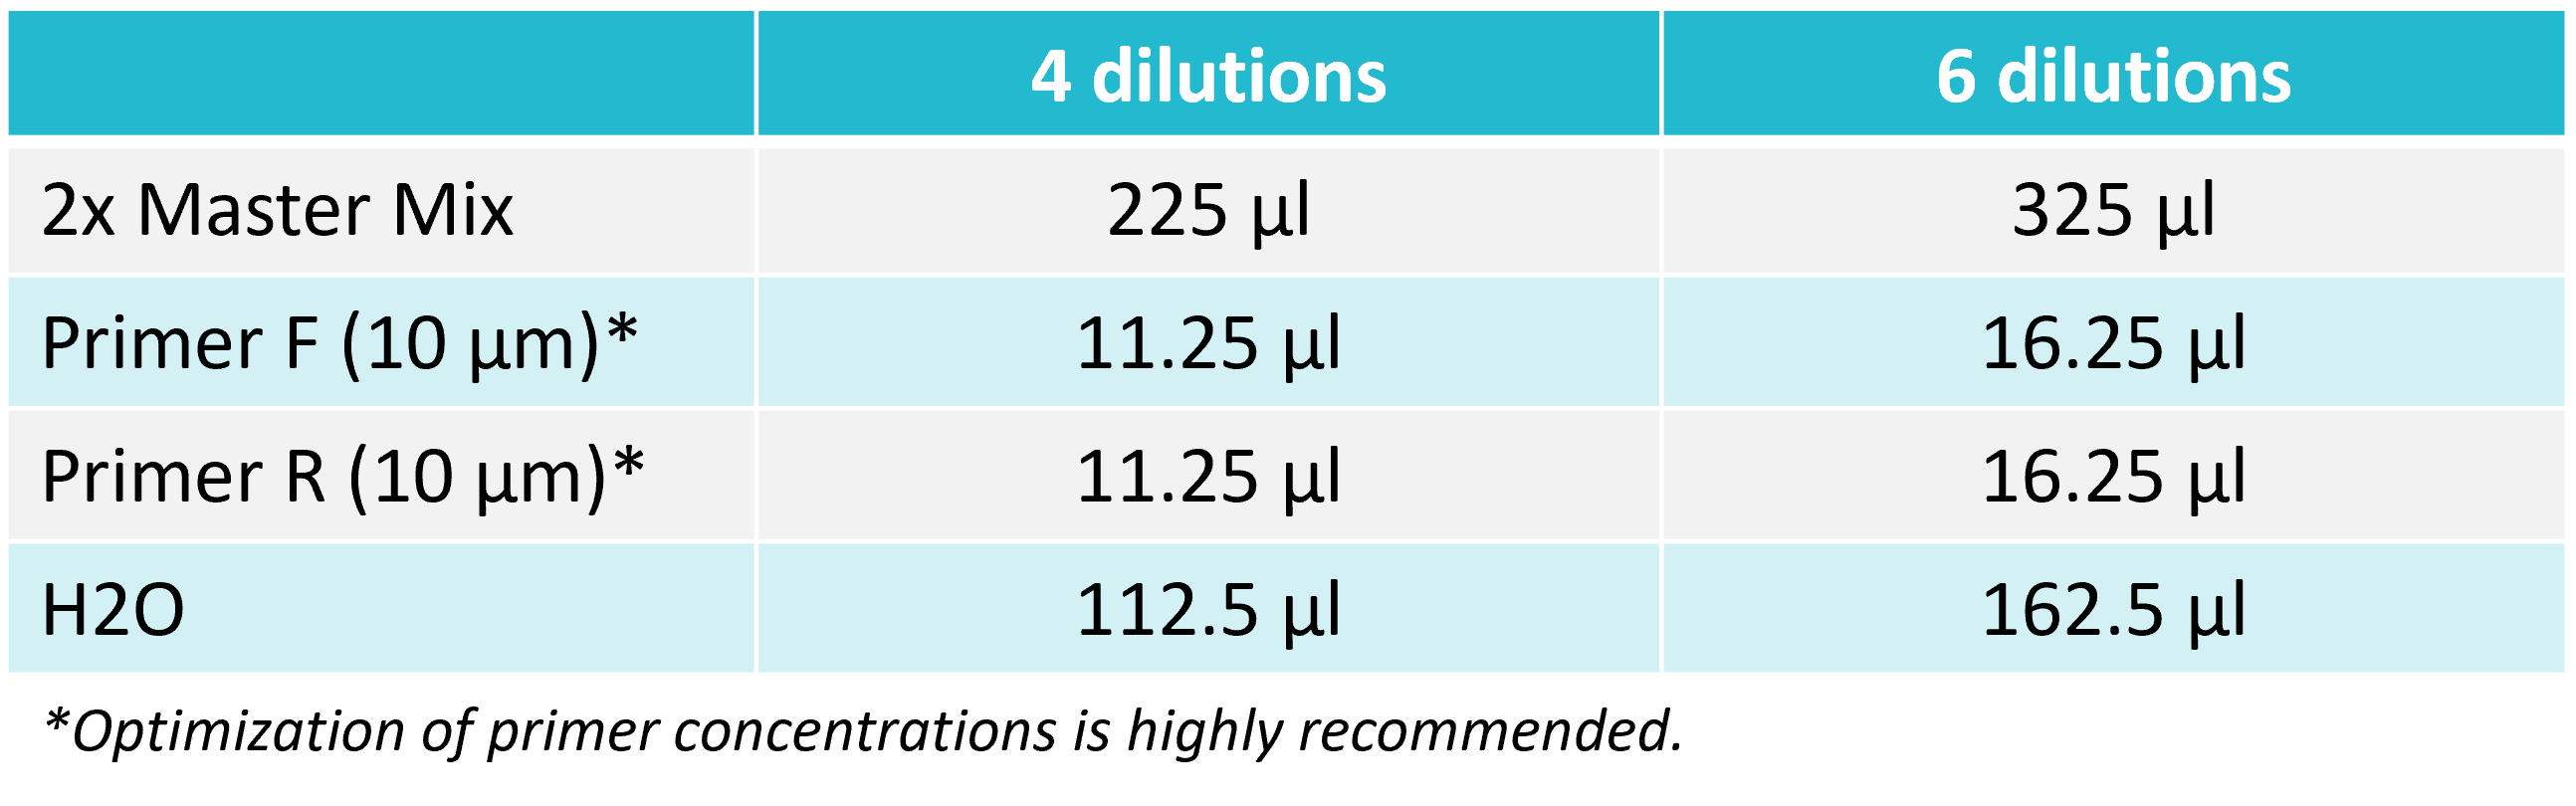
2. Prepare a reaction mix
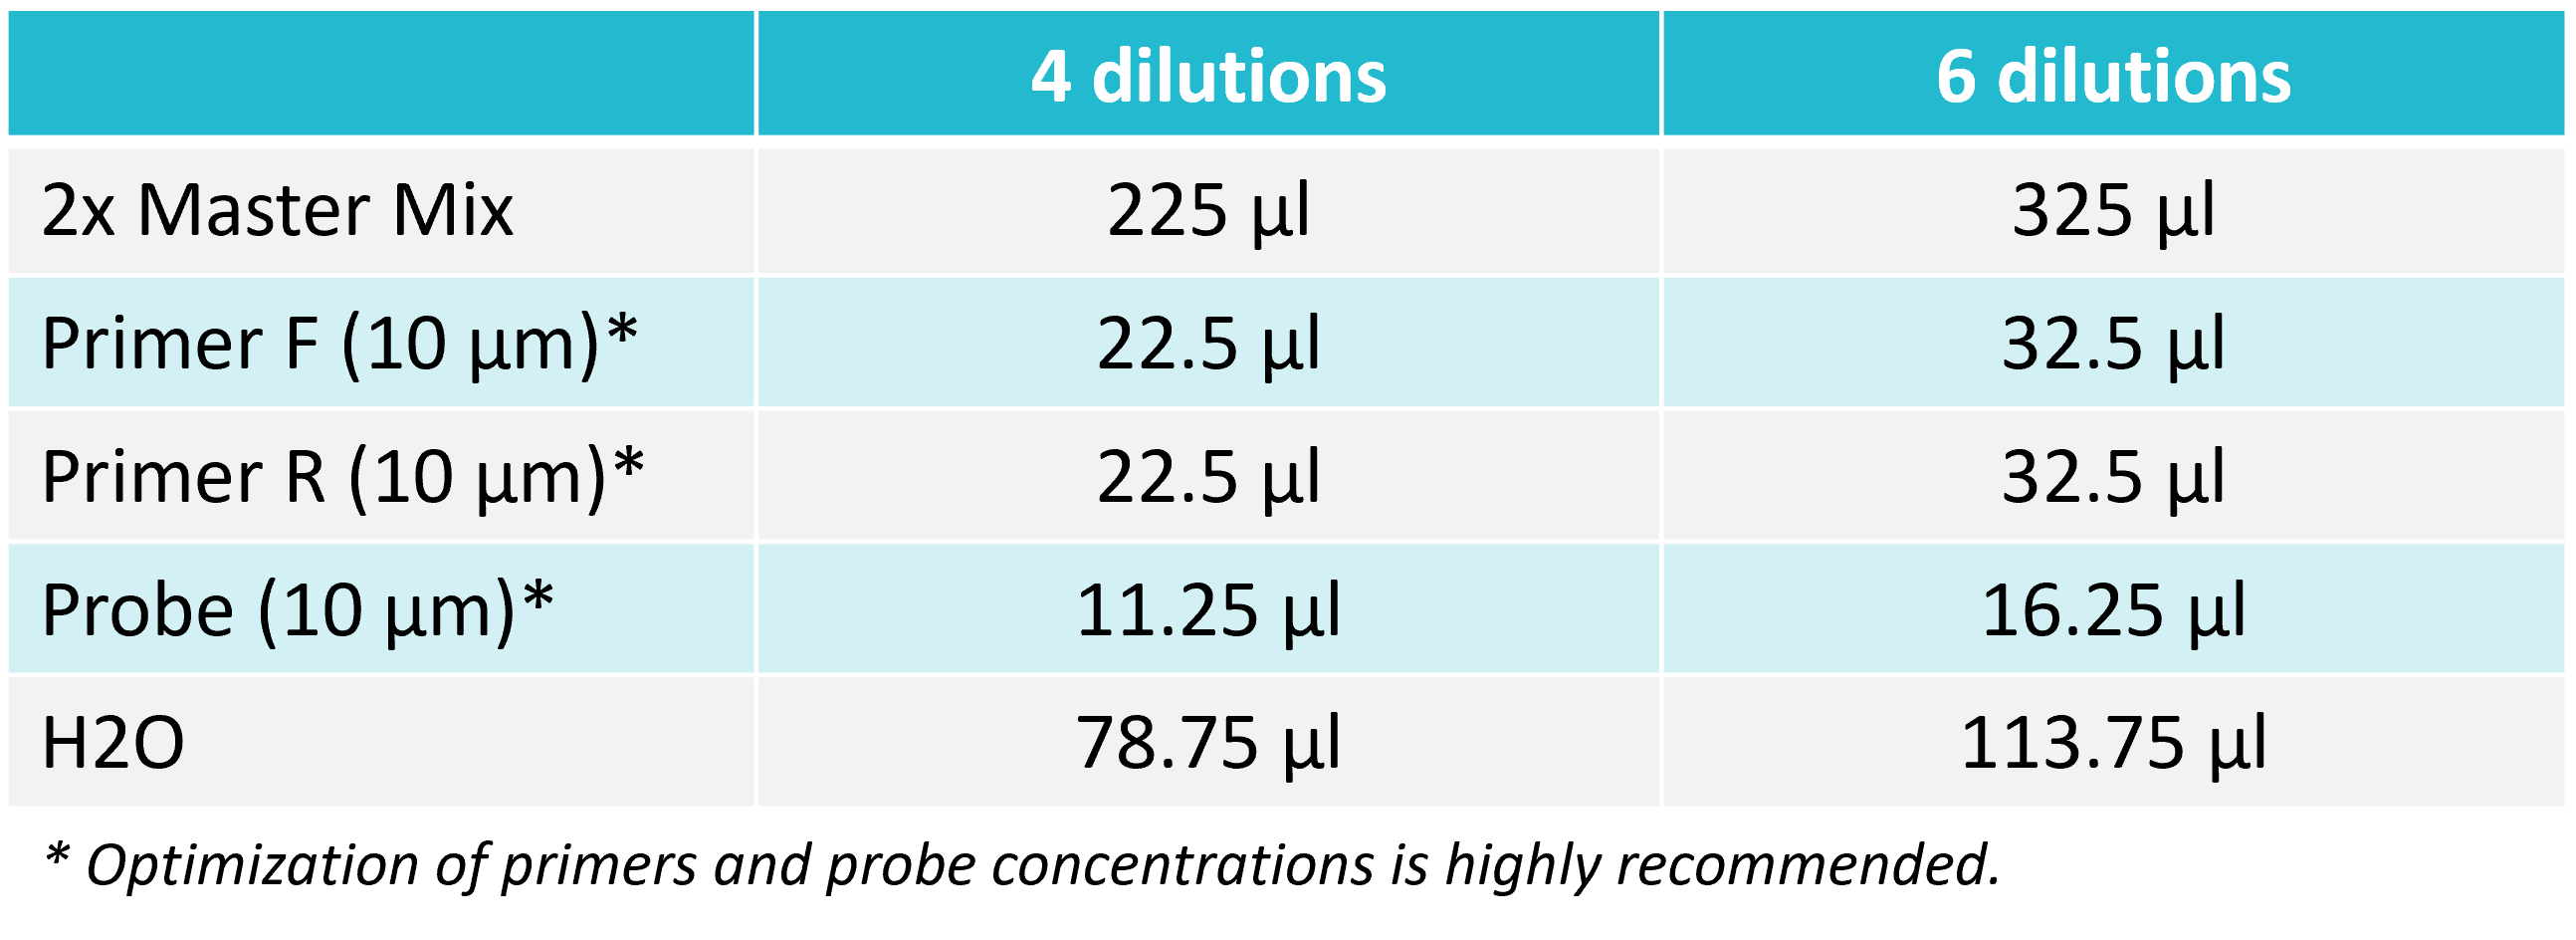
Prepare a reaction mix according to the table below. After adding all the components, vortex for 2 seconds and spin down.
For Probe
3. Distribute the reaction mix
Distribute 20 µl of the reaction mix into the bottom of the blue wells according to the figure below.
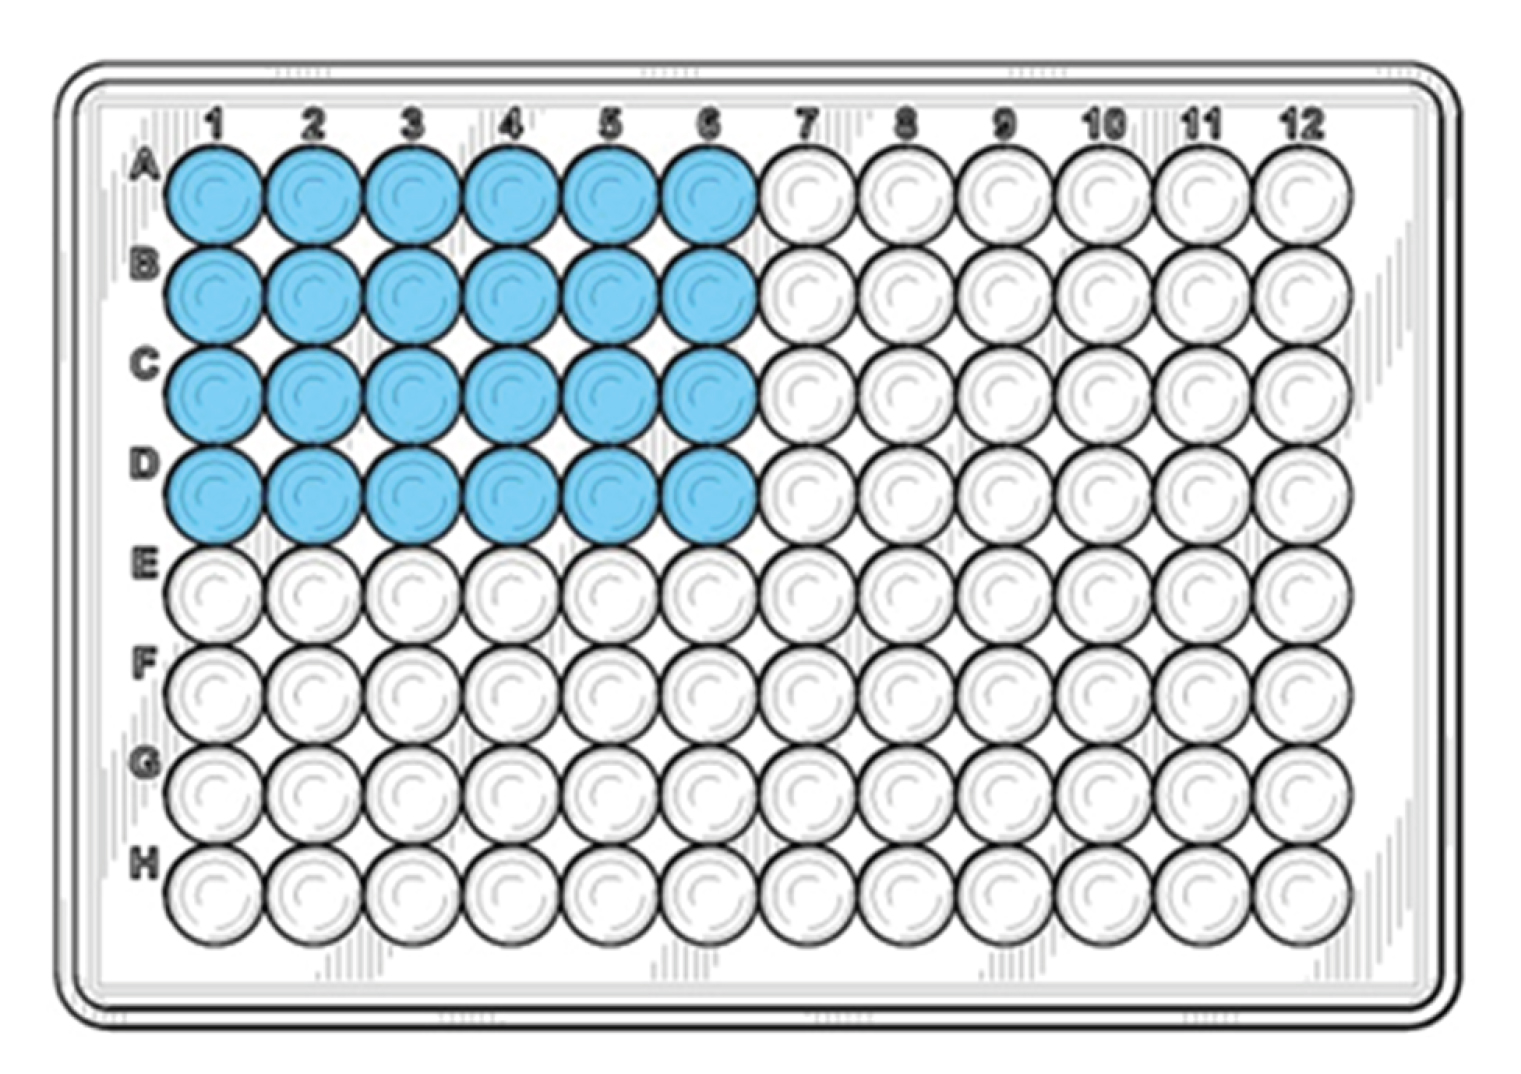
4. Distribute the DNA
Distribute 5 µl of DNA from the dilution series, into the wells. Make sure that the tip is submerged as little as possible into the liquid of the tube and the well. DNA should be distributed into the liquid and not onto the sides of the wells.

NB: Do not pipet up and down into the wells; the DNA will mix during the initial heating of the PCR run.
The numbers in the figure above correspond to the tube numbers in the dilution series in step 1. Add PCR Grade Water to the NTC wells instead of DNA.
5. Run the plate
Use the PCR cycling protocol below when running the plate on the real-time PCR instrument. Run the melt curve according to instrument default settings.

For Probe
No Melt Curve settings
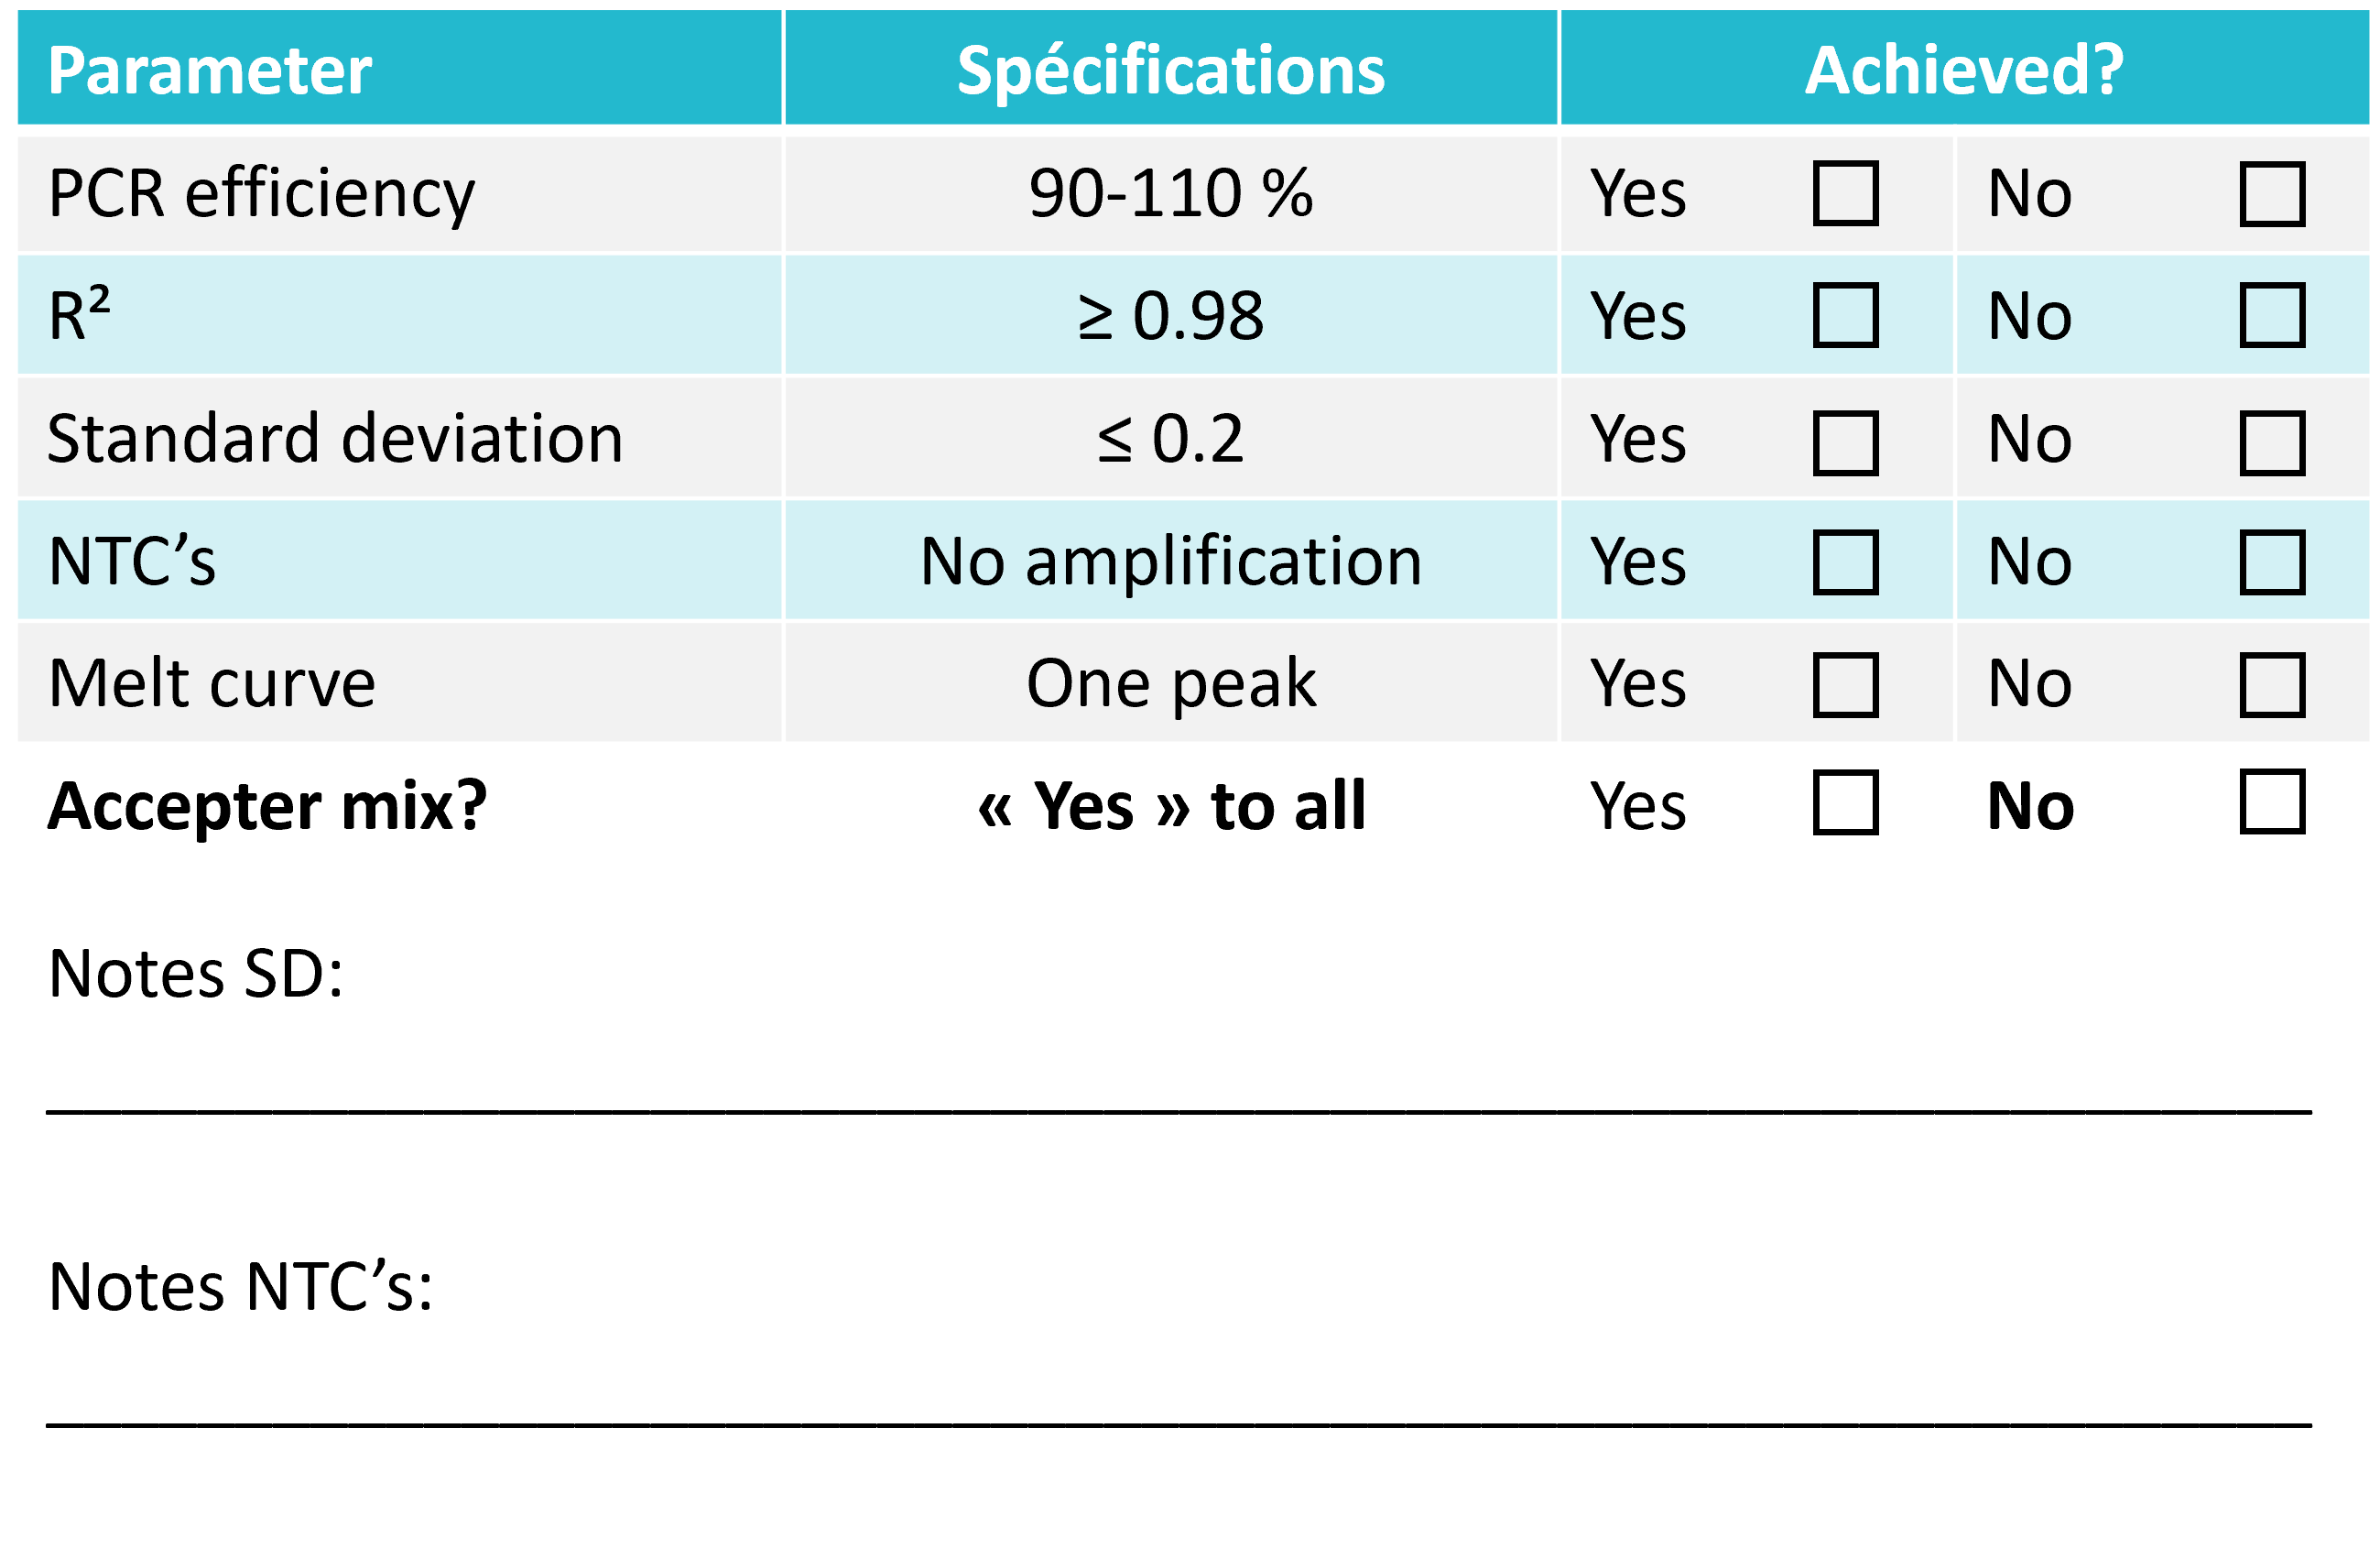
6. Evaluate the results
The results should be within the specifications listed below in order to accept the mix. Use the table below to evaluate the mix.
 |
 |
For Probe
No Melt Curve result
Notes
The results should be within the listed specifications in order to accept the mix. Note that the parameters: melt point and Cq-values, are buffer-dependent and therefore cannot, nor should give the exact same results as experiments with a different buffer.
For a better understanding of what to look for when evaluating a mix please read the guidelines below.
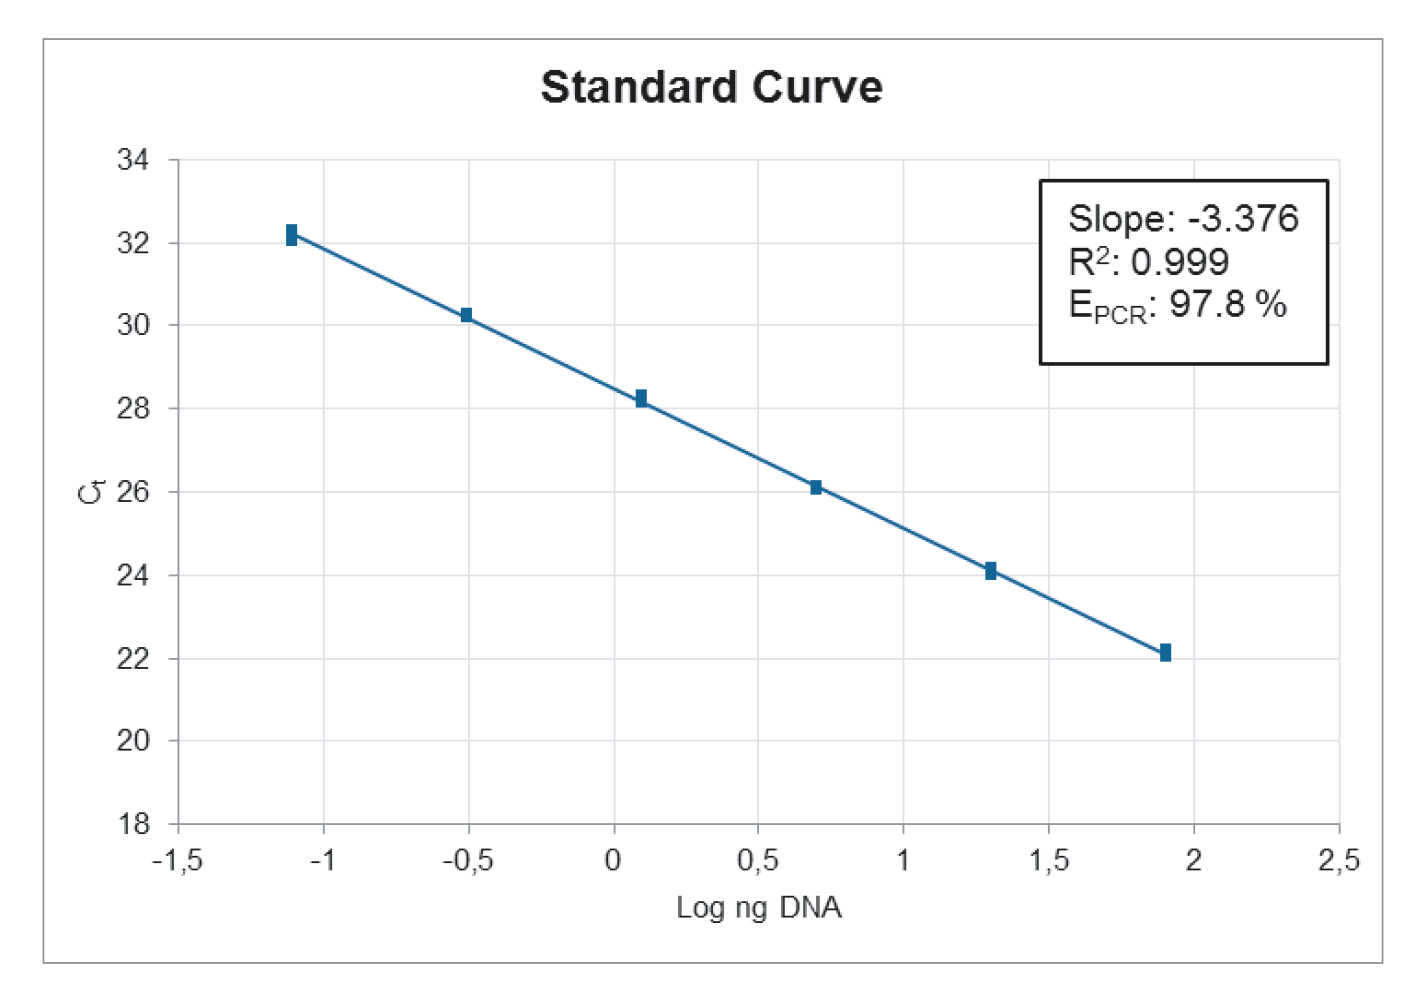
Standard Curve:
When looking at the standard curve, the three main parameters to focus on are: PCR efficiency, R2-value and standard deviation between replicates.
The PCR efficiency indicates how efficient the target has been amplified and should be between 90-110 % to be acceptable. This is one of the most important parameters to look at when evaluating a mix.
The R2-value is a statistical measure of how close the data are fitted to the regression line and should be ≥ 0.98.
The standard deviation between replicates indicates the accuracy of pipetting. The standard deviation should be ≤ 0.2.
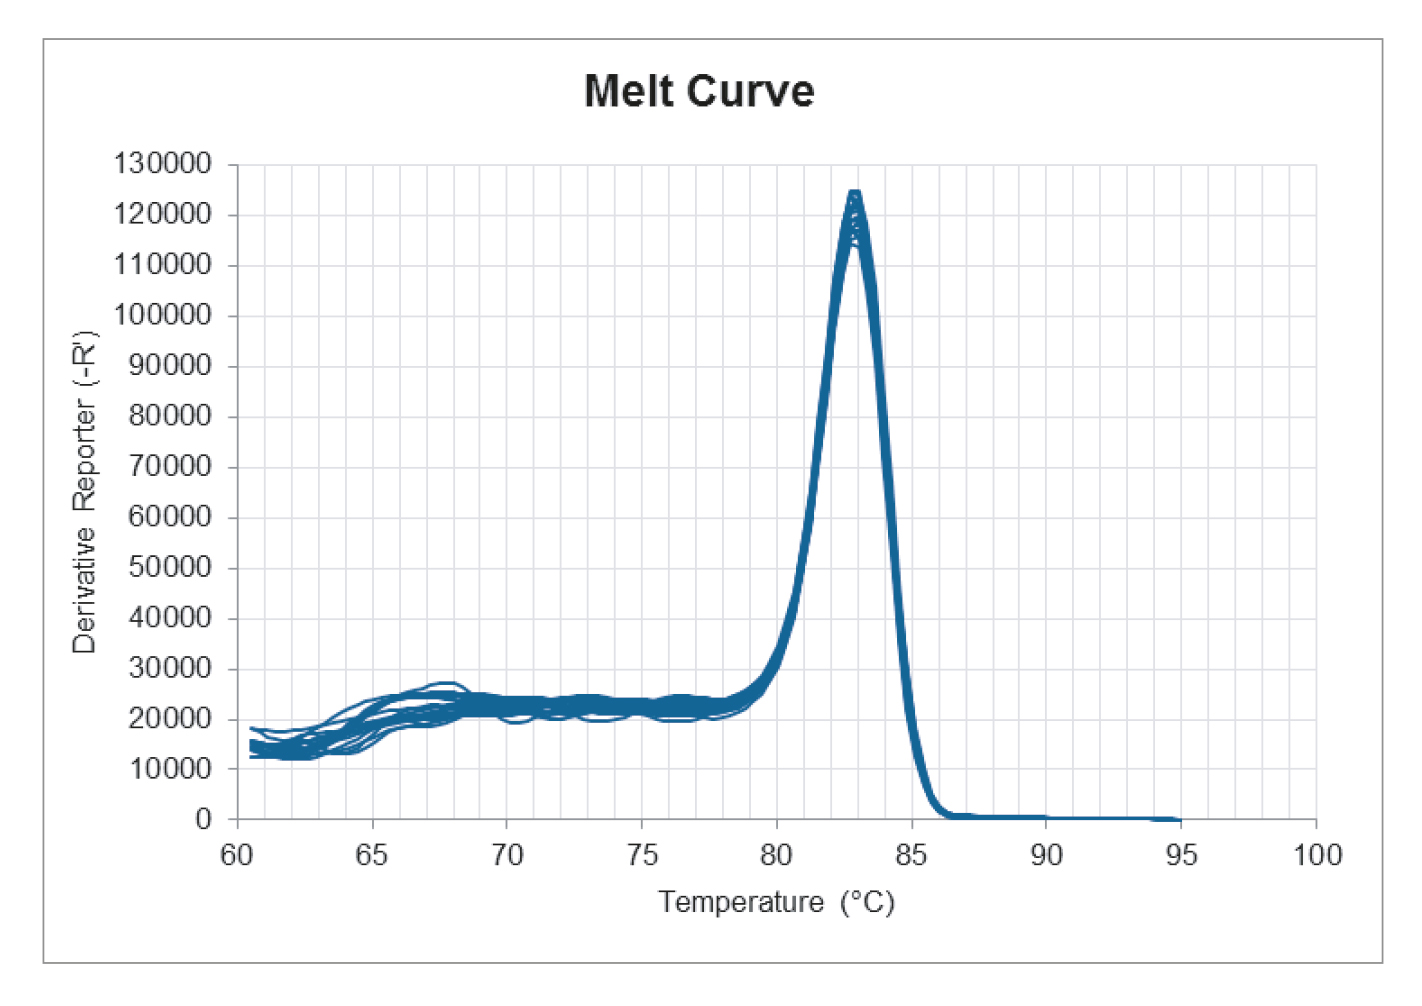
Melt curve:
When looking at the melt curve there should be one distinct peak at the intended melt temperature of the product. It is important to note that the melt temperature is pH- and buffer dependent. Therefore, it cannot be expected that PCR products from two different mixes have the exact same melt temperature. A difference of a few degrees in melt temperature is not important for how well the mix performs.
The NTC’s should not have a peak at the same melt temperature as the intended product. If this is the case, then there is a contamination, which can give a fake contribution to the results.
Other peaks than the peaks from the intended product can appear in the melt curve plot and is an indication of unspecific amplification. As long as the peaks are really small or as long as the NTC wells appear on the amplification plot ≥ 40 cycles or ≥ 10 cycles after the lowest DNA concentration, then the unspecific amplification can be neglected.
Cq-value
Cq-values should be evaluated in relation to PCR efficiency and not be the only focus of interpretation, as long as the PCR efficiency is calculated and kept within the specifications (90-110 %). If the Cq-value is extremely high, it can be due to a low PCR efficiency, and thus the issue might be detected in the evaluation of efficiency.
Inconsistency in Cq-values can also be due to inhibitors in the sample and may result in an efficiency of more than 110 %.
Furthermore Cq-value can be influenced by SYBR level, ROX level and target length (when running SYBR experiments) and can therefore vary from master mix to master mix. Small differences in Cq-values are expected when comparing two mixes.
SYBR Level
It is less relevant to look at SYBR levels when evaluating a master mix. This can be manipulated by simply adding more SYBR to the buffer and has not necessarily anything to do with how well the mix performs. Too much SYBR can inhibit the PCR amplification, but if this is an issue, then it will be detected when evaluating the PCR efficiency.
Furthermore, the SYBR level can be influenced by ROX if the amplification plot is plotted with Rn or ΔRn on the y-axis. Only in the multicomponent view of an amplification does the ROX not influence the Cq-value.
Comparing two mixes
If two different master mixes are compared, then prepare a reaction mix with the other master mix as well and with the same primer concentrations.
If the same PCR cycling protocol is used, then distribute the reaction mix and DNA dilutions according to step 3 and 4 but in wells A7 to D12. Run the melt curve according to instrument default settings.
If the other master mix is run with a different PCR cycling protocol, then distribute the reaction mix and DNA dilutions into a second PCR plate according to step 3 and 4. Run the plates separately. Run the melt curve according to instrument default settings.
Other parameters
This guideline focuses on simplicity and keeping the required amount of work time to a limit. In order to make a thorough evaluation of a master mix other parameters should be taken into account. The most important parameters include:
- Primer and probe design
- Annealing temperature
- Primer and probe concentration
- Sample concentration
- Inhibitors contamination
- Choice of controls
- Setting threshold
- Correct fluorescence chemistry
When looking at all these parameters it is possible to make a deep and thorough evaluation and the experiment setup will then be optimal.
Extact from the Ampliqon items:
Know more:
- Flyers
- Search Real Time Master Mixes online
- To contact us so that we can best support you:
- Phone: +33 4 70 03 73 06
- Email : biosciences@advion-interchim.com


