There is no shortage of possibilities for how to study a photochemical reaction.
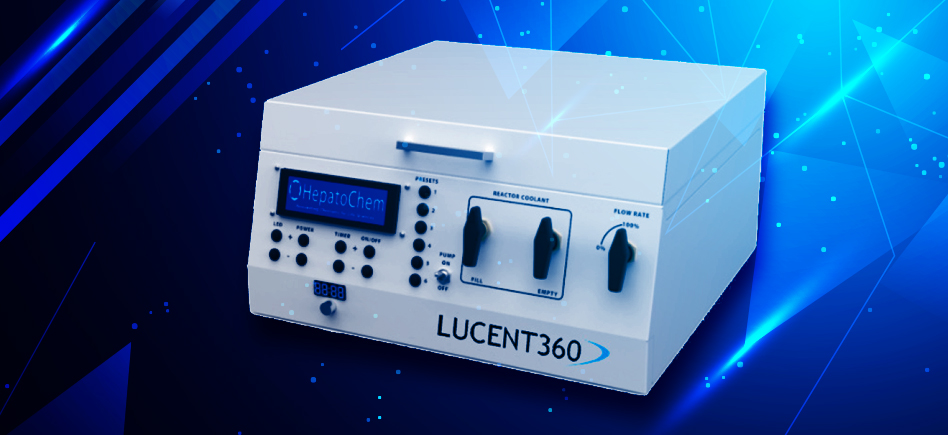
We are pleased to share a series of experiments that demonstrate the value of the Lucent360™ for studying a photochemical reaction in batch and in flow chemistry did by HepatoChem scientists with chemists* at the IRCOF and Oril in France.
Ces expériences ont été réalisées par les scientifiques d’HepatoChem et les chimistes* de l’IRCOF et d’Oril en France.
- *Philippe Jubault, Romain Lapierre, Thi Minh Thi Le and Thomas Poisson, IRCOF, COBRA Laboratory UMR6014, Rouen, Normandy, France
- *Bruno Schiavi and Damien Thevenet Oril Industrie – Bolbec – Normandy – Affiliated with “Les Laboratoires Servier”, France
They compared few steps for taking a new reaction from the screening scale to both batch and flow in the same system, the Lucent360™.
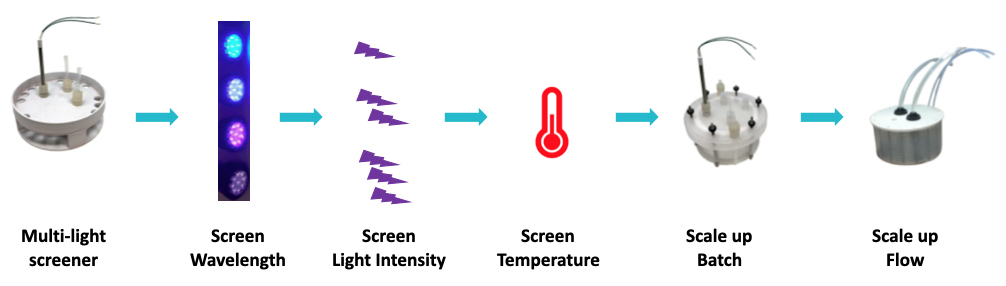
Figure 1: Example Workflow Using Lucent360™
Lucent360™ workflow example with the multi-light screener
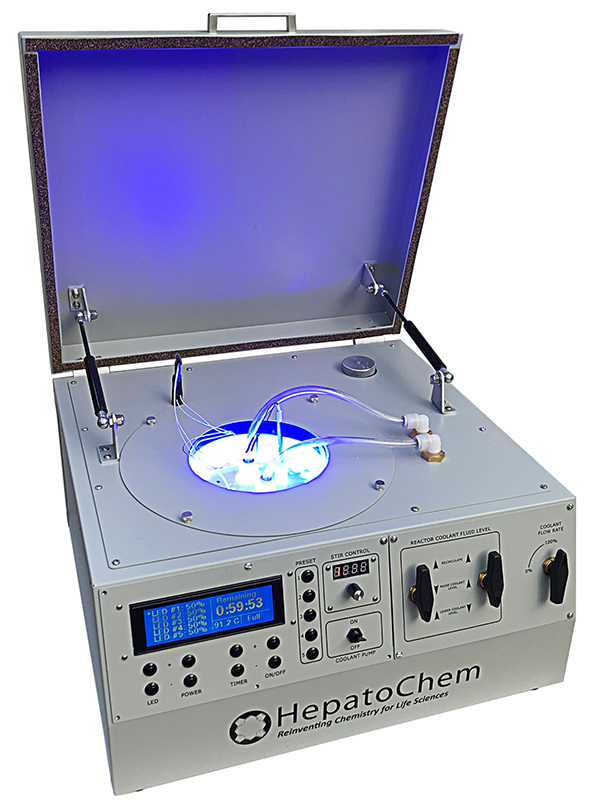
The very innovative Lucent360™ is designed with 5 interchangeable LED modules (4 side modules and 1 bottom module) to fully immerse a temperature-controlled chamber with light.
Each interchangeable LED module can operate at either 365nm, 380nm, 405nm and 450nm with variable light intensity.
Interchangeable vial holders for reactions vials from ranging from 0.3 ml up to 20 ml fit in the reaction chamber and allow chemists to screen 16 up to 48 reactions at a time (depending on the vial size). They can select the temperature and keep the T°C reaction constant from 0°C to 80°C.
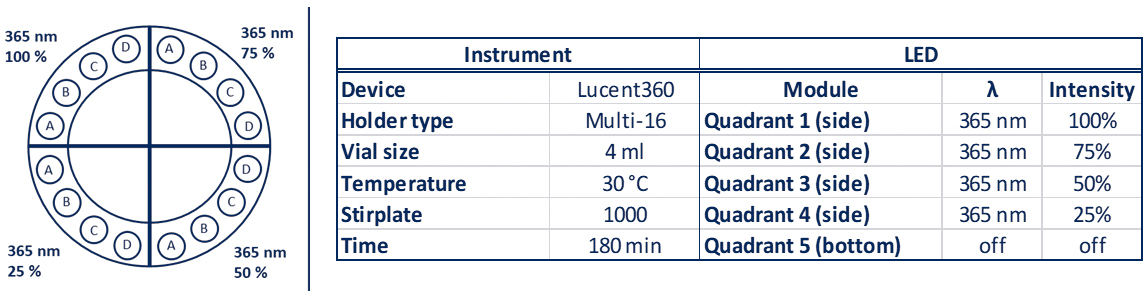
A typical experiment with a standard holder might be something that looks like: 4 side 450nm LEDs set at 100% intensity, with the reaction chamber set at 30°C, 24 vials total, each @ 4mL each containing a set of test substrates with 24 different catalysts (Table 1).
Table 1: Lucent360™ experiment parameters for a typical experiment
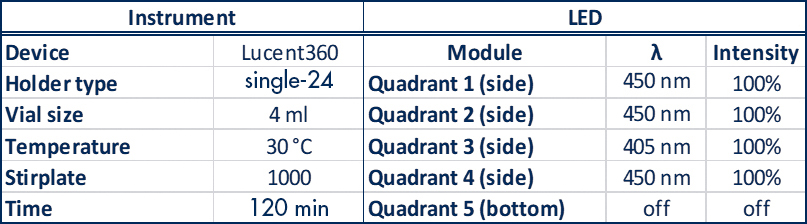
In this example, we can quickly answer the question, which catalyst works the best. Or you can mix and match a screen or solvents, or bases, or an additive… We may already own a device that can handle a screen like this…
Multi-light screener experiments
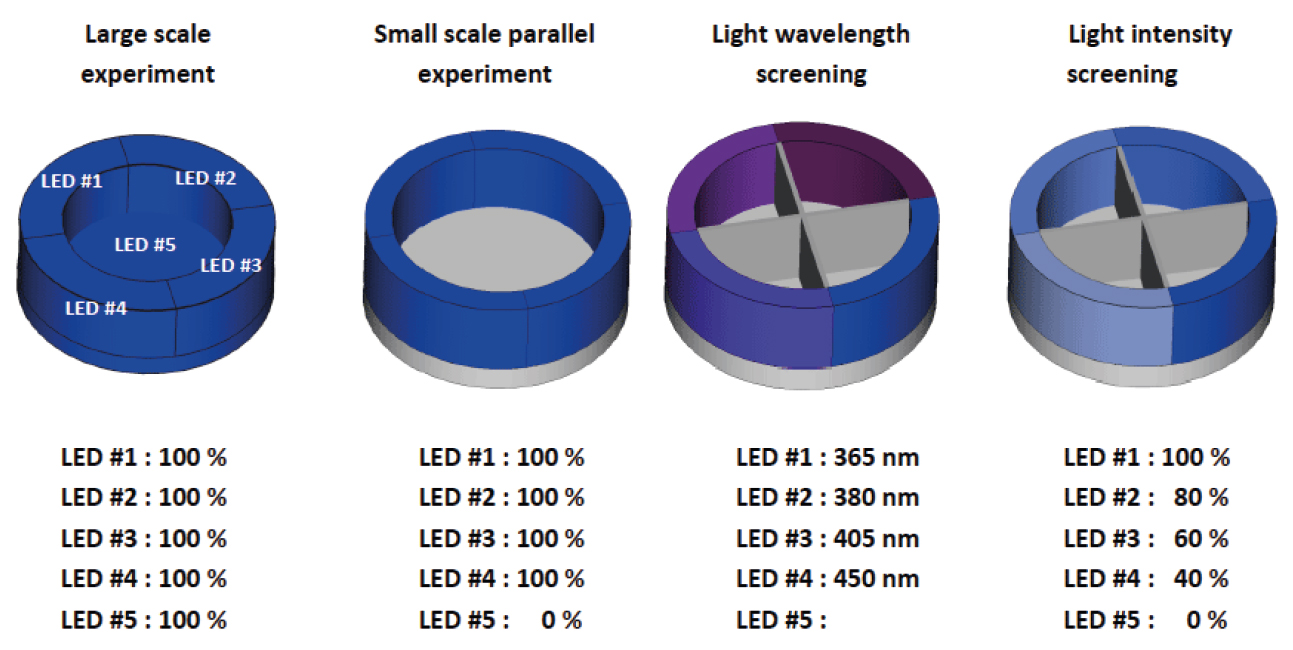
This is the multi-light screener holder (Figure 2) that unlocks the power of the Lucent360™.
The multi-light screener separates the light from each quadrant allowing each module to operate independently with a different wavelength or light intensity under the same temperature and experimental conditions.
Instead of running a full set of experiments over and over again, to change different parameters, get more information out of each screen.
Figure 2: Multi-light screener

Photo-Arbuzov reaction in Lucent360™
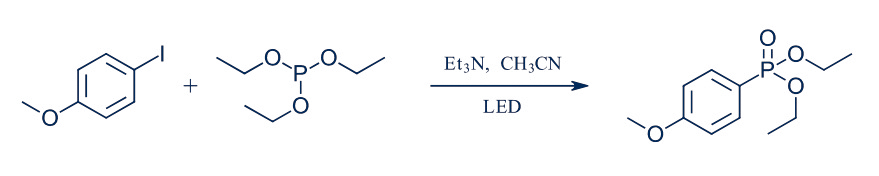
The Hepatochem chemists set out to investigate this photochemical version of the Arbuzov reaction (Figure 3): reaction of an alkyl halide and a trialkyl phosphite to make an alkyl phosponate as a reaction that was originally performed in flow at the IRCOF and Oril, from France as mentioned above.
Several steps were investigating.
Figure 3: Photo-Arbuzov reaction in Lucent360™
Step 1:
Screen Wavelength
To start, the chemists had to find the wavelength and the concentration which should run the best for this reaction.
With the Lucent360™, it is straightforward to test multiple wavelengths in a single experiment.
For example, screen 16 conditions – 4 wavelengths, 4 concentrations in one experiment with temperature control.
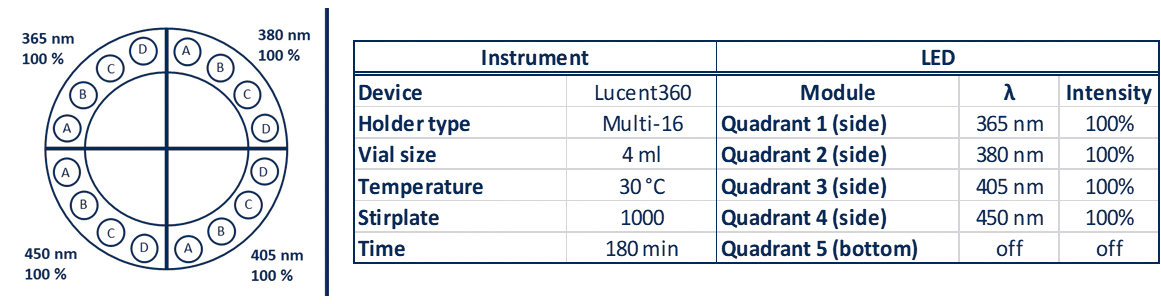
For the Arbuzov reaction, the reactions were performed in the Lucent360™ , equipped with 4 different side light modules (365nm, 380nm, 405nm, 450nm) set at 100% intensity using the multi-light screening module.
Each reaction was prepared in a glove box with sparged acetonitrile in 4mL crimp cap vials with 2 × 7mm stir bars. In each quadrant, were four experimental conditions investigating 3 concentrations of the 2 coupling components (0.05M, 0.1M, 0.2M iodoanisole) and a control without triethylphosphite. (p-iodoanisole (1 equiv.), triethylphosphite (2 equiv.), triethylamine (2 equiv.), in 2mL ACN).
For all experiments, the products were identified by LC-MS with quantification by DAD in comparison to calibration standards of anisole diethylphosphonate.
Table 2: Wavelength screen (% product at 180 min) with 100% light intensity
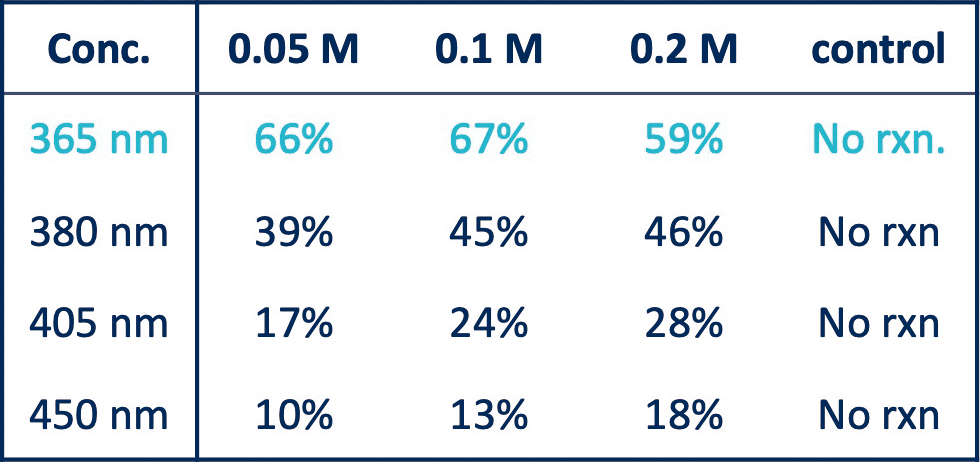
Figure 4: Time course for 0.1 M reactions vs. wavelength
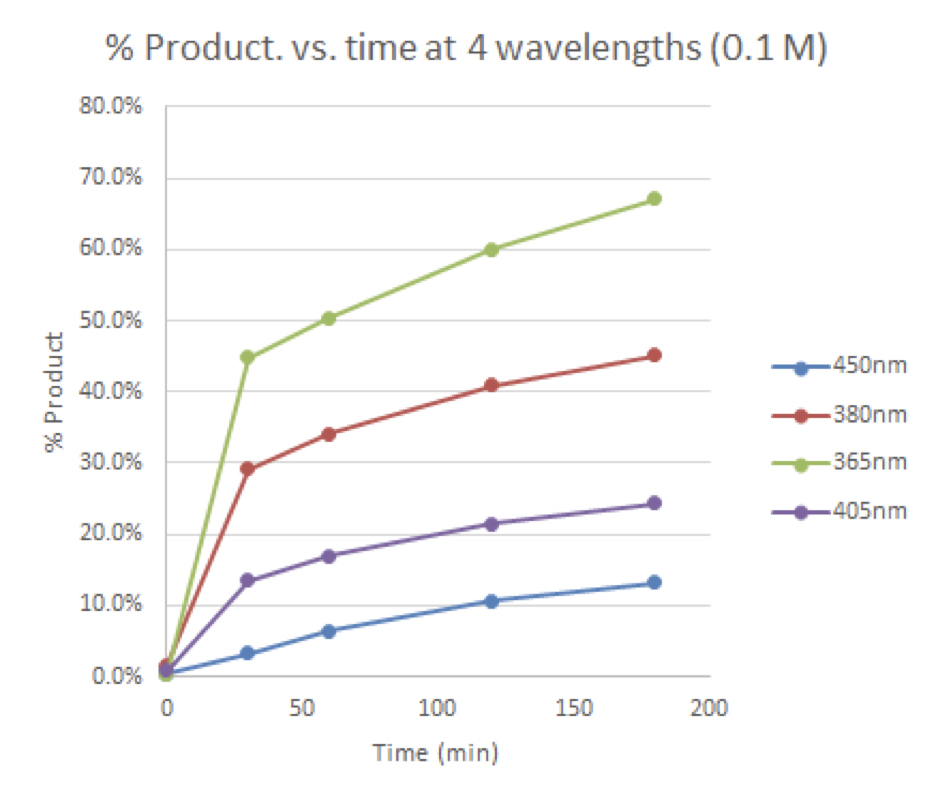
Step 2:
Screen Light intensity
After selecting 365nm as the best wavelength, the chemists had to find how much light do they to have optimal reaction because too little light, and we may not be optimizing our reaction rate. Too much light might be detrimental for a host of reasons, such as instable products, or starting materials, unwanted side reactions, or simply to limit the amount of cooling required to keep the reaction temperature constant.
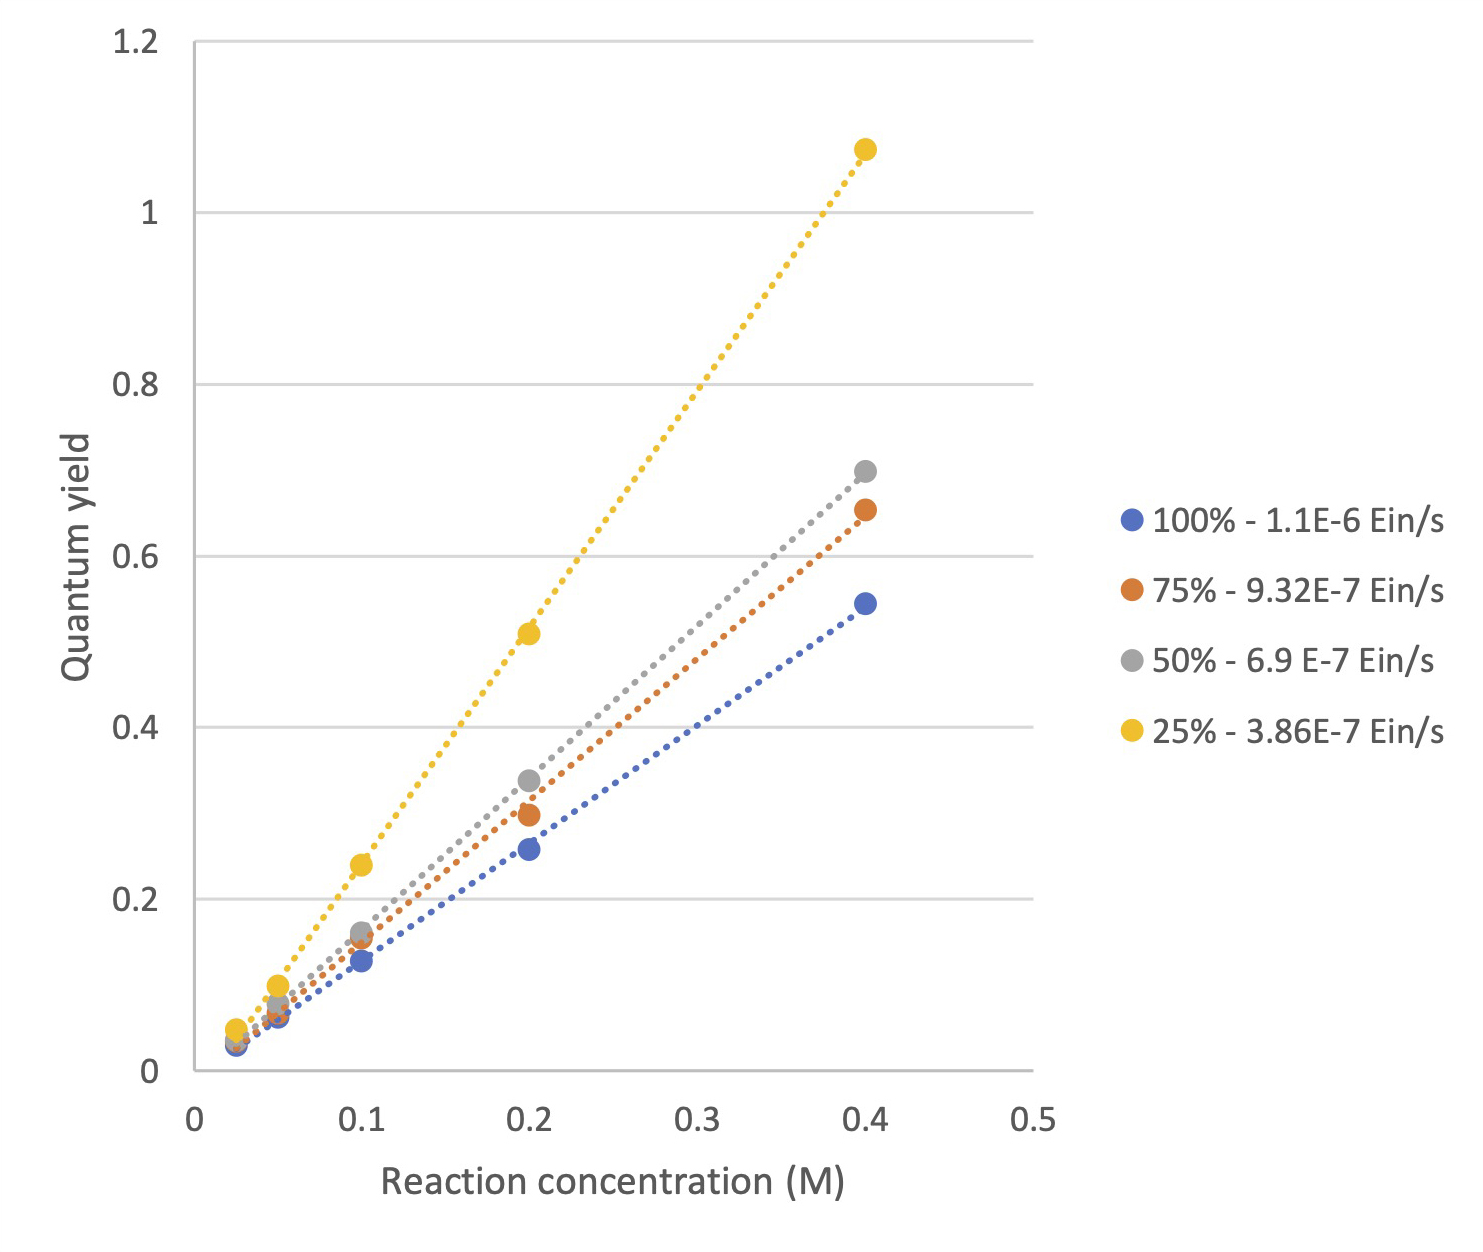
They screen 16 reactions (four reaction concentrations 0.05M, 0.1M, 0.2M, 0.4M) in the Lucent360™ equipped with four side 365nm modules set at 25, 50, 75, 100% intensity using the multi-light screening module. The photon flux for each intensity was determined by chemical actinometry.
For these reactions, in the Lucent360™, each quadrant corresponds to the following photon flux (3.9×10⁻⁷ Einstein/s, 6.9×10⁻⁷ Einstein, 9.3×10⁻⁷ Einstein/s and 1.1 x10⁻⁶ Einstein/s,).
There are many levels to the data that can be acquired in one set of experiment like this, (final product, impurities, remaining starting material, initial rate of the reaction, and quantum yield). Chemists have plotted it all.
What stood out for them in this data is an interesting effect when they use the initial rate of each reaction, along with the chemical actinometry data to determine the quantum yield at each concentration and light intensity.
For each light intensity, the quantum yield has a linear relationship with the reaction concentration (see Figure 5).
Table 3: Product formation at 5 min with varying light intensity
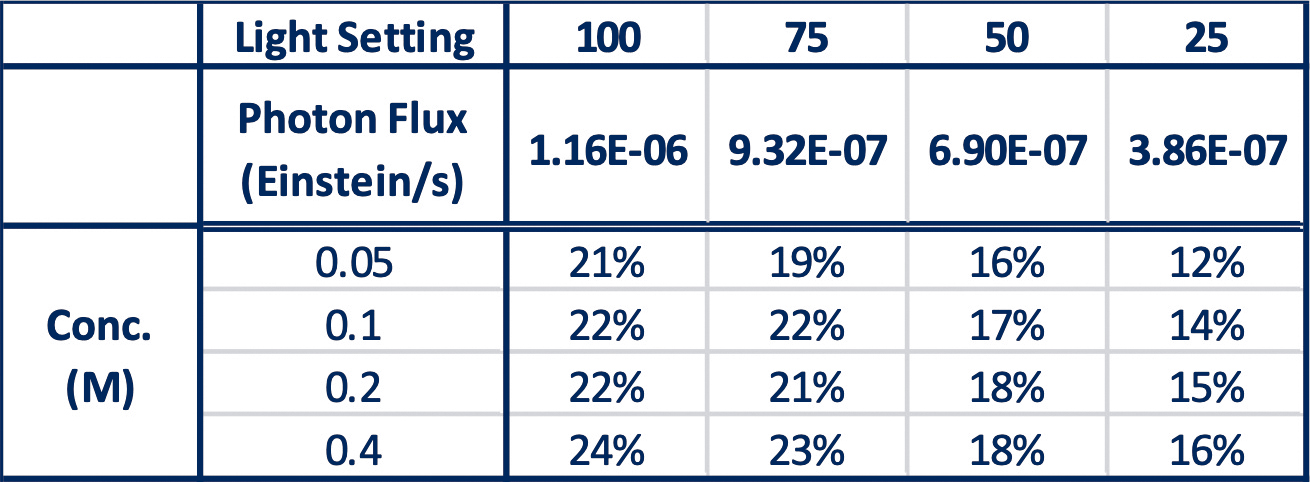
Table 4: Quantum Yield of each reaction determine at 5 minutes
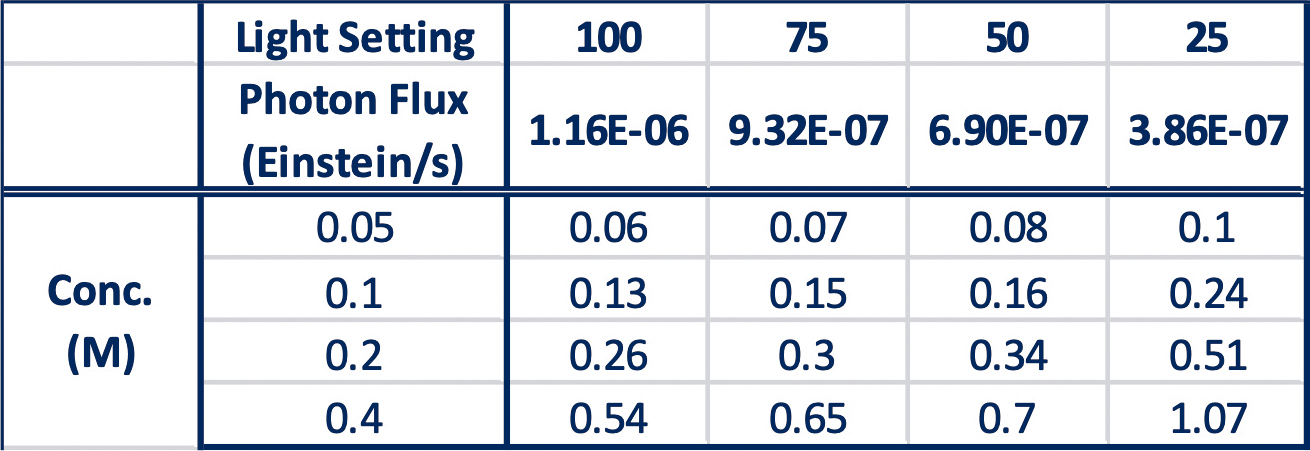
Figure 5: Quantum yield vs. Reaction concentration based on initial rate (5 min)
Step 3:
Screen Temperature
After selecting how much light they need to have optimal reaction, the chemists used the temperature control portion of the instrument to monitor this reaction at temperatures from 10°C up to 50°C with a few additional controls.
They used the Lucent360™, equipped with four 365nm side light modules at 100% intensity and monitored the time course of each reaction.
Here, they observed very little difference in product formation vs. temperature for both the initial point and at 300 minutes, however, higher temperature (40 and 50°C) had significantly higher conversion at 120 and 240 minutes.
Table 5: Effect of Temperature on reaction
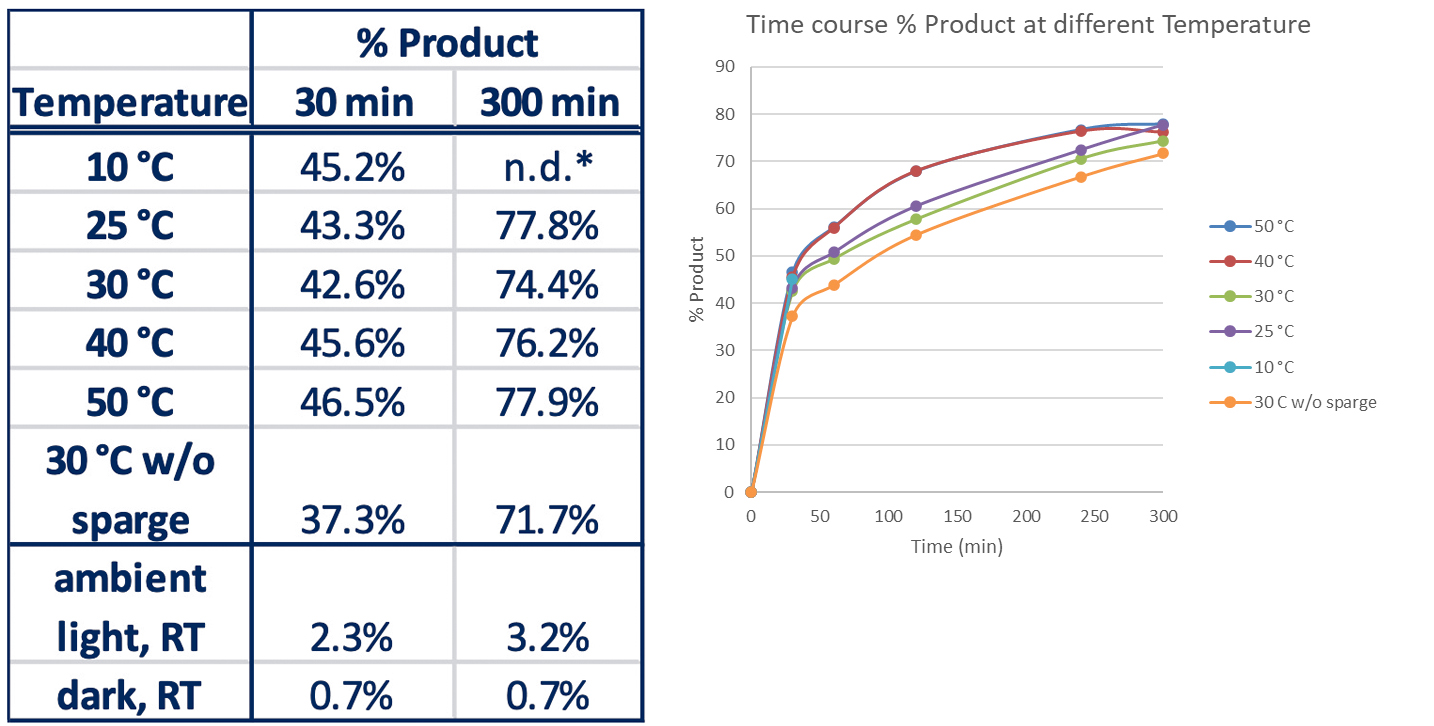
Only initial time point determined for 10°C experiment
Step 4:
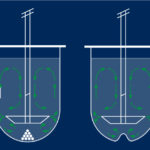
Scale up in Batch
These screening tests are nice, but for most people the end goal is a reaction that can be scaled to produce a useful amount of material.
The Lucent360™ used to screen the Arbuzov reaction, can also be directly used to scale up the reaction in batch.
Chemists tested their phosphonylation reaction in a 500mL reactor (includes inlet and outlet port to cool reaction, gas line in/out and a temperature probe to monitor the reaction) and sparged with N2.

The reaction was performed with 5 light modules (365 nm) at 100%, 50°C at 500mL scale and 23.4g p-iodoanisole corresponding to the 0.2M concentration condition. They did not go up to 50°C based on previous data.
They just wanted to demonstrate an example of scaling up a reaction to 500mL, with the lights full blast and the heat control on and maintain the temperature for the full run of the experiment. They monitored the reaction and observed:
- 56% product at 5 hours (32.9% starting material remaining) – ~13.7g product formed in 5 hours.
- 68% product at 22 hours (17% starting material remaining) – ~16.6g product formed in 22 hours.
Step 5:
Scale up in Flow ?
As the reaction works in batch, how does it look in flow?
Chemists took the parameters that they established from the batch reactions, along with some previously reported residence times for this reaction in flow and tested the Lucent360™ with the 20mL flow cell.
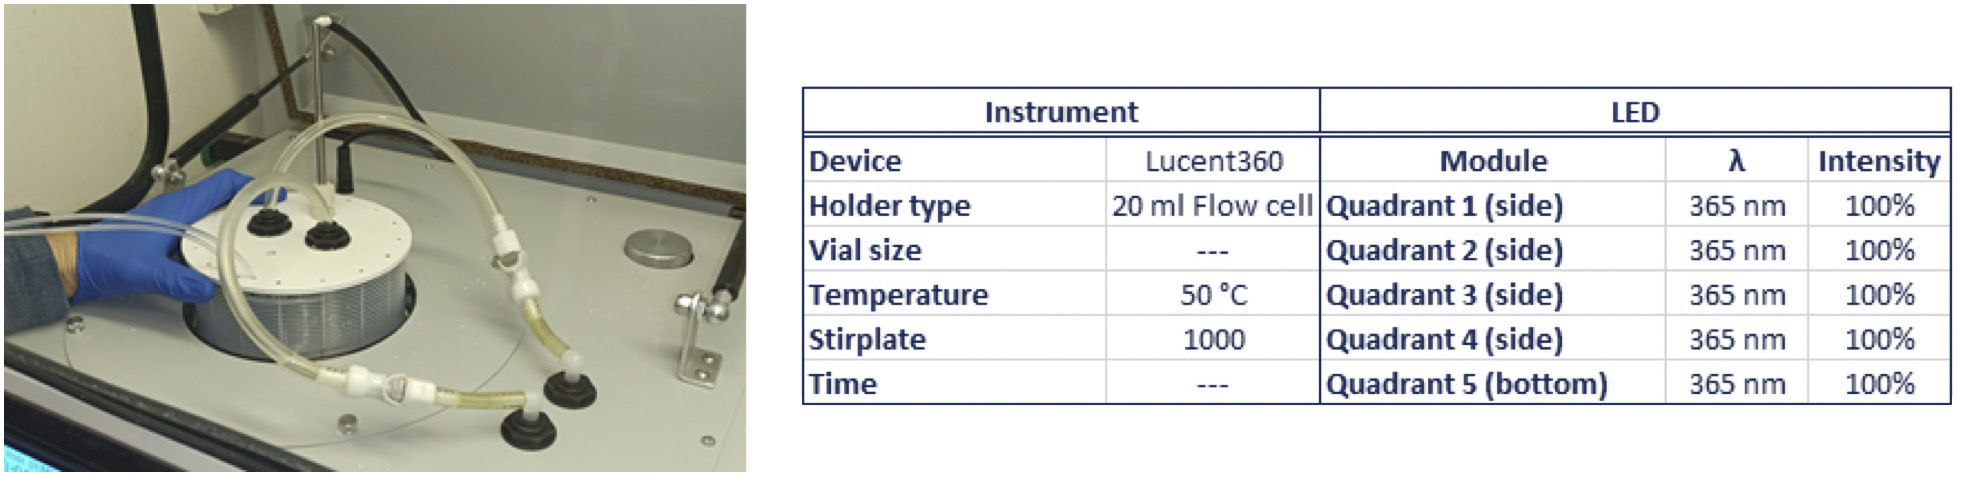
To start, they prepared a 40mL mixture of the 0.2M scale reaction in sparged acetonitrile. The reaction was performed at 50°C with 365nm light (5 quadrants) at 100% light intensity with a 20mL flow cell.
The flow rate set was set at either 6mL/hour (190min residence time) or 13mL/hour (90 minutes residence time). Aliquots taken through the course of the run and diluted into DMSO for analysis.
Similar conversions were observed for the flow reactions in comparison to the batch reaction. However, for this specific reaction, the long residence time makes the throughput in batch in significantly higher for batch than flow.
Figure 6: Comparing batch and Flow

Summary
With the versatile Lucent360™, using the interchangeable LED modules, vial holders and multi-light screening tool, it is possible to identify important information regarding the reaction parameters needed to scale a reaction to both batch and flow.
Know more:
- Find out what Advion Interchim Scientific can provide for the Lucent360™, in its flow chemistry version.
- See our other synthesis systems on www.interchim.com
- Contact us: chemistry.tools@advion-interchim.com


